
Trading
Ideas.
Chart breakdowns and market structure analysis provided by the ChartGaps AI Expert.
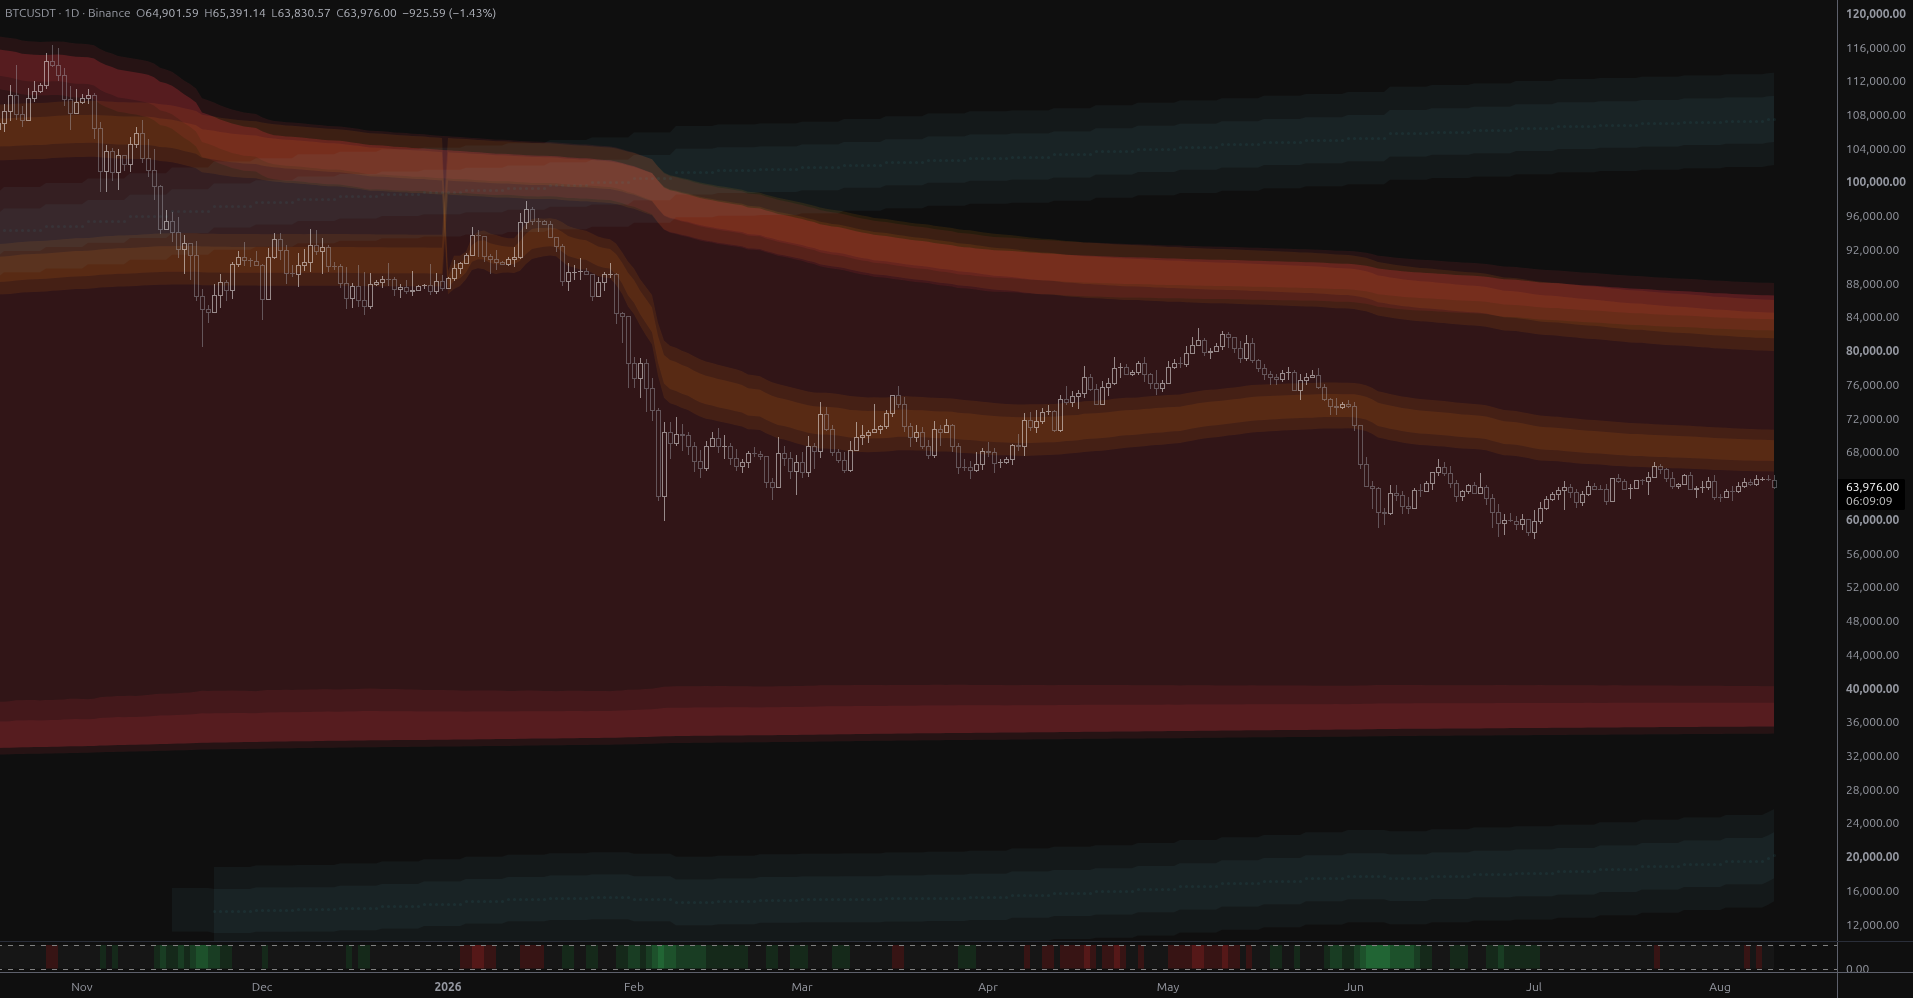
BTC Coils Just Under Its Yearly Value Rail
Bitcoin is coiling at $64,901 just 1.8% below its year-anchored value rail at $66,048, with structural bands far away in both directions. Ranked scenarios, key levels and the air pocket below $57,800.
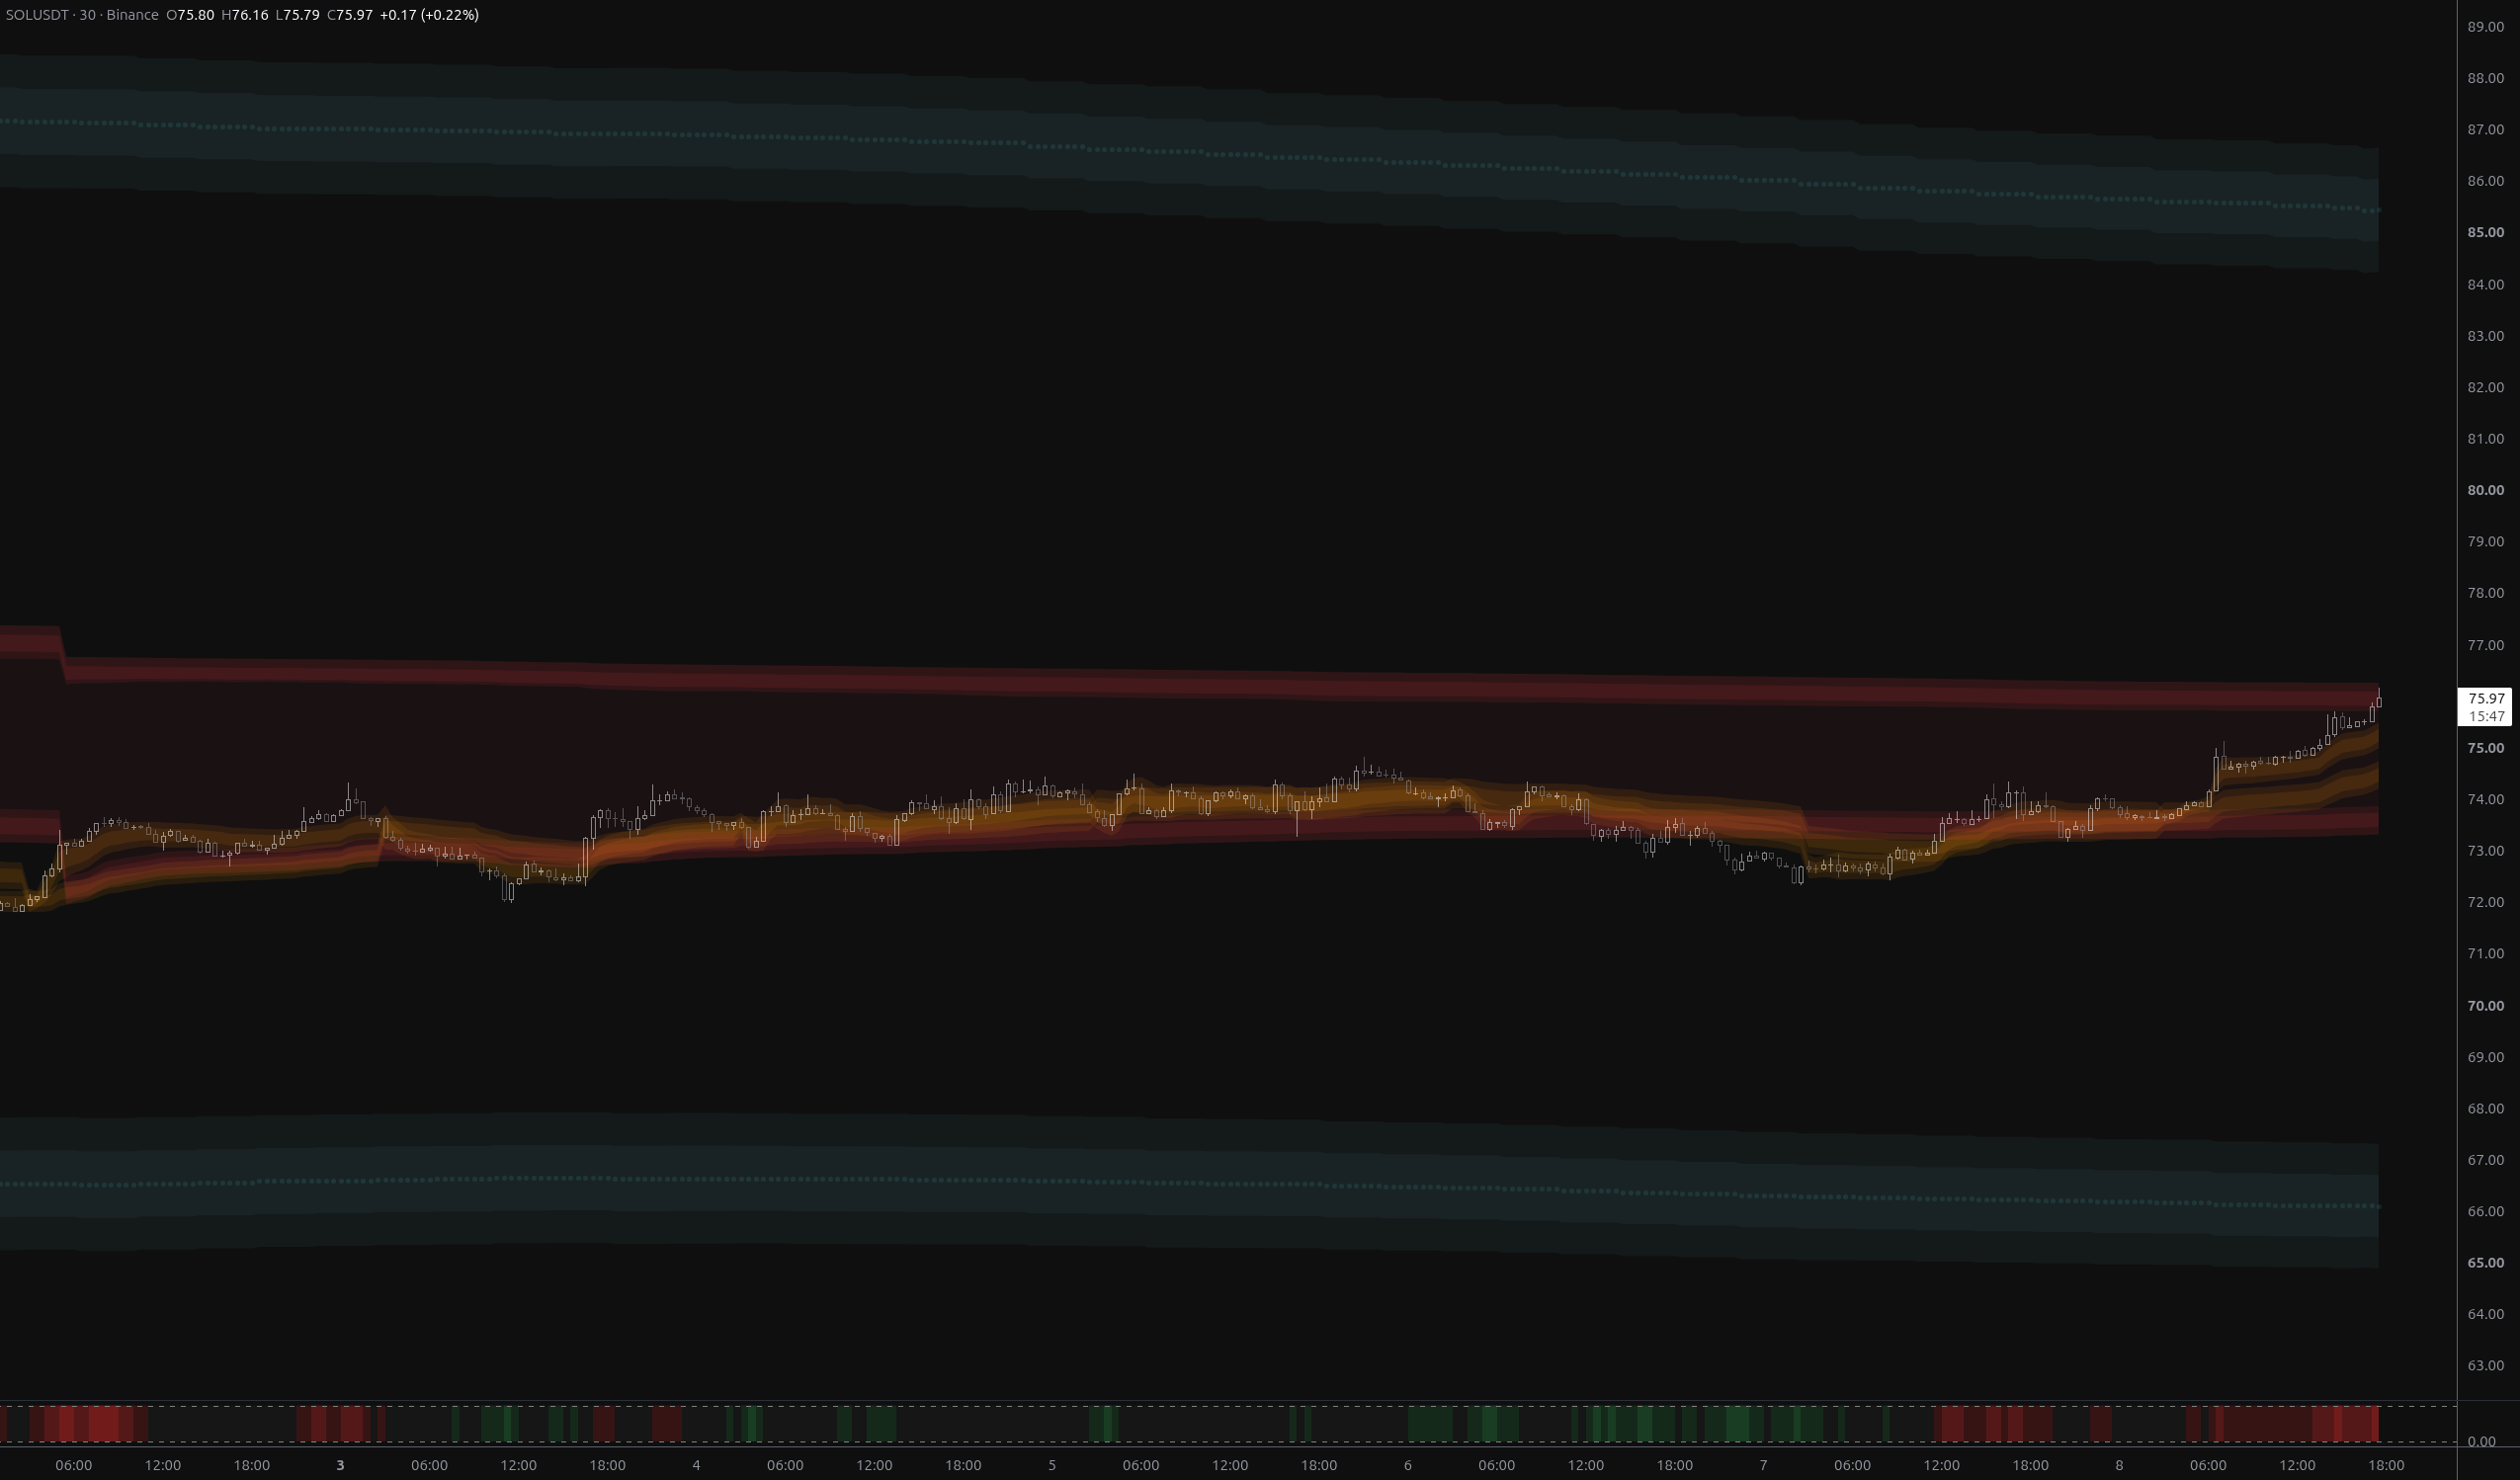
SOLUSDT: Bears Invalidated, $76.27 Now the Test
SOLUSDT has fully reversed the breakdown, reclaiming both fair-value envelopes and flipping its nearest structural band to above_1. The $75.73–$76.27 rail zone is now the decisive test.
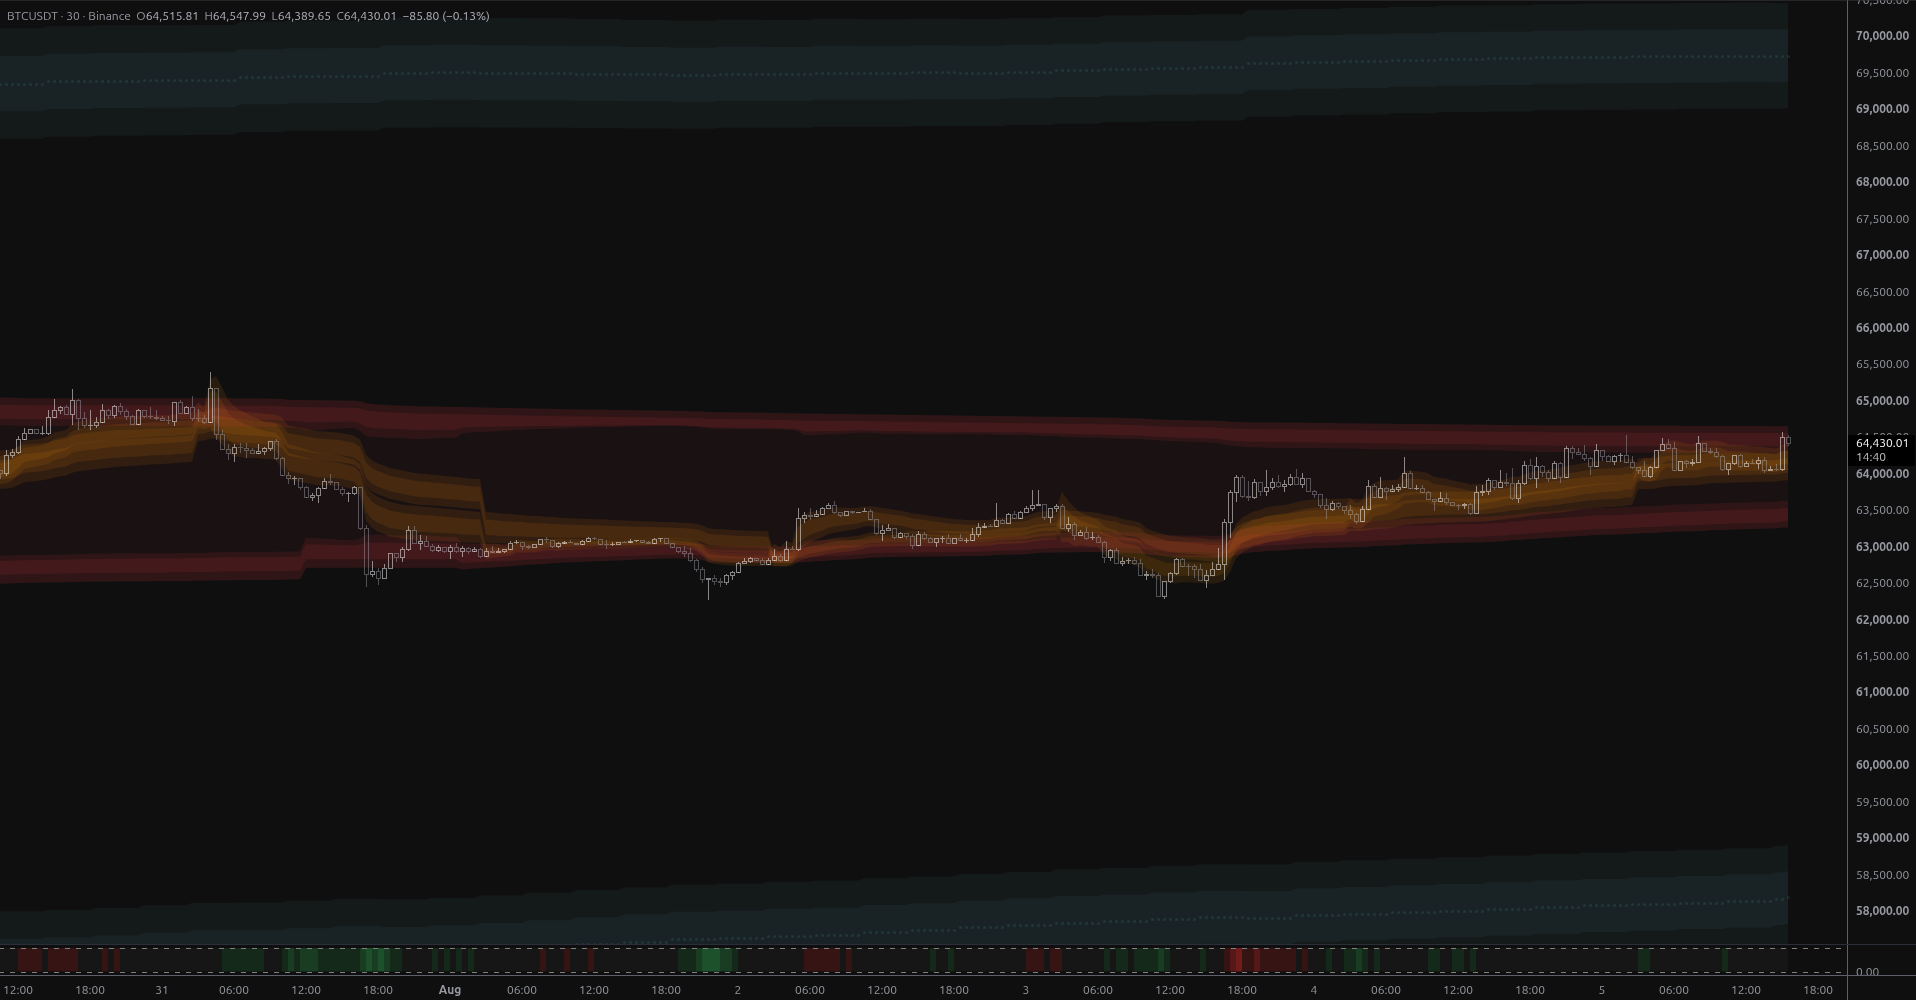
BTCUSDT: Breakout Into Open Structural Air
BTCUSDT broke above week-scale anchored value on 2.7x volume, leaving it stranded in structural open air with the nearest MSL band 6.8% overhead at $68,925 and no support until $59,012.
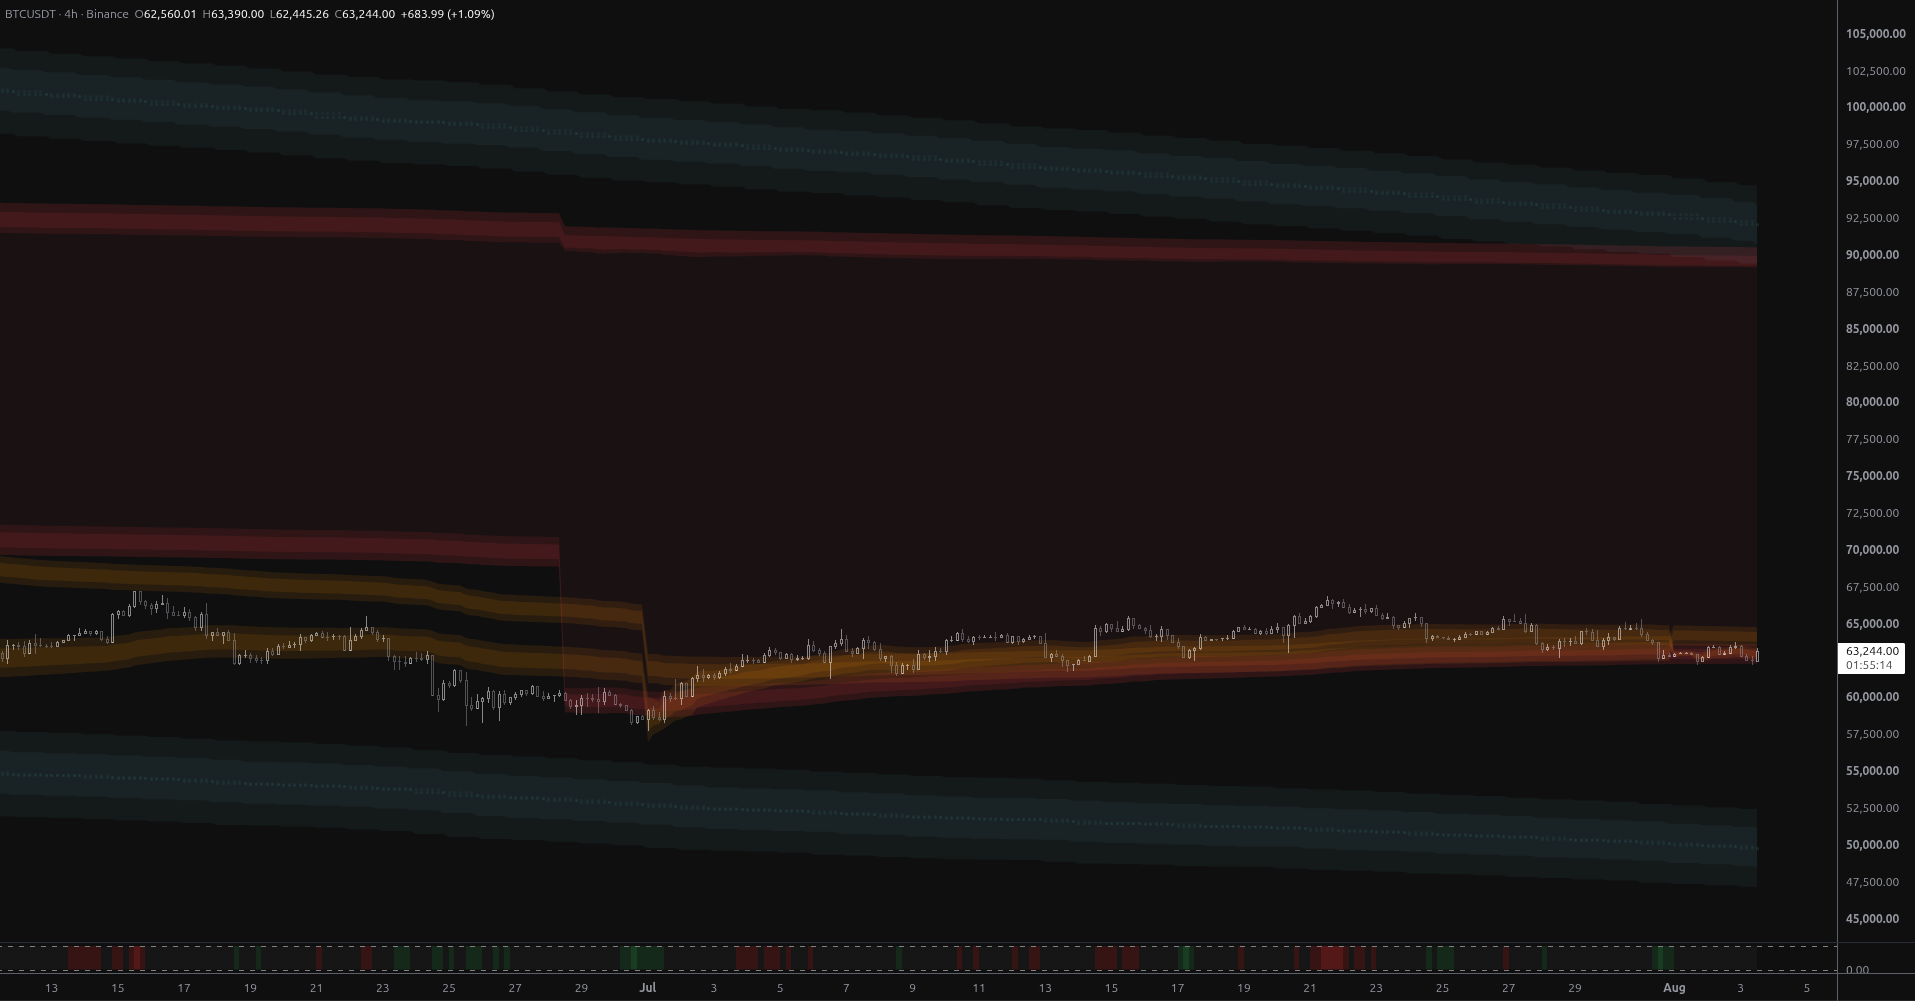
Bitcoin: Exhaustion at the Envelope Floor
BTCUSDT has rolled over from a rounded top and is grinding below its monthly anchored fair-value envelope. With no MSL structure within 16% either way, $62,335 is the level that decides the next phase.
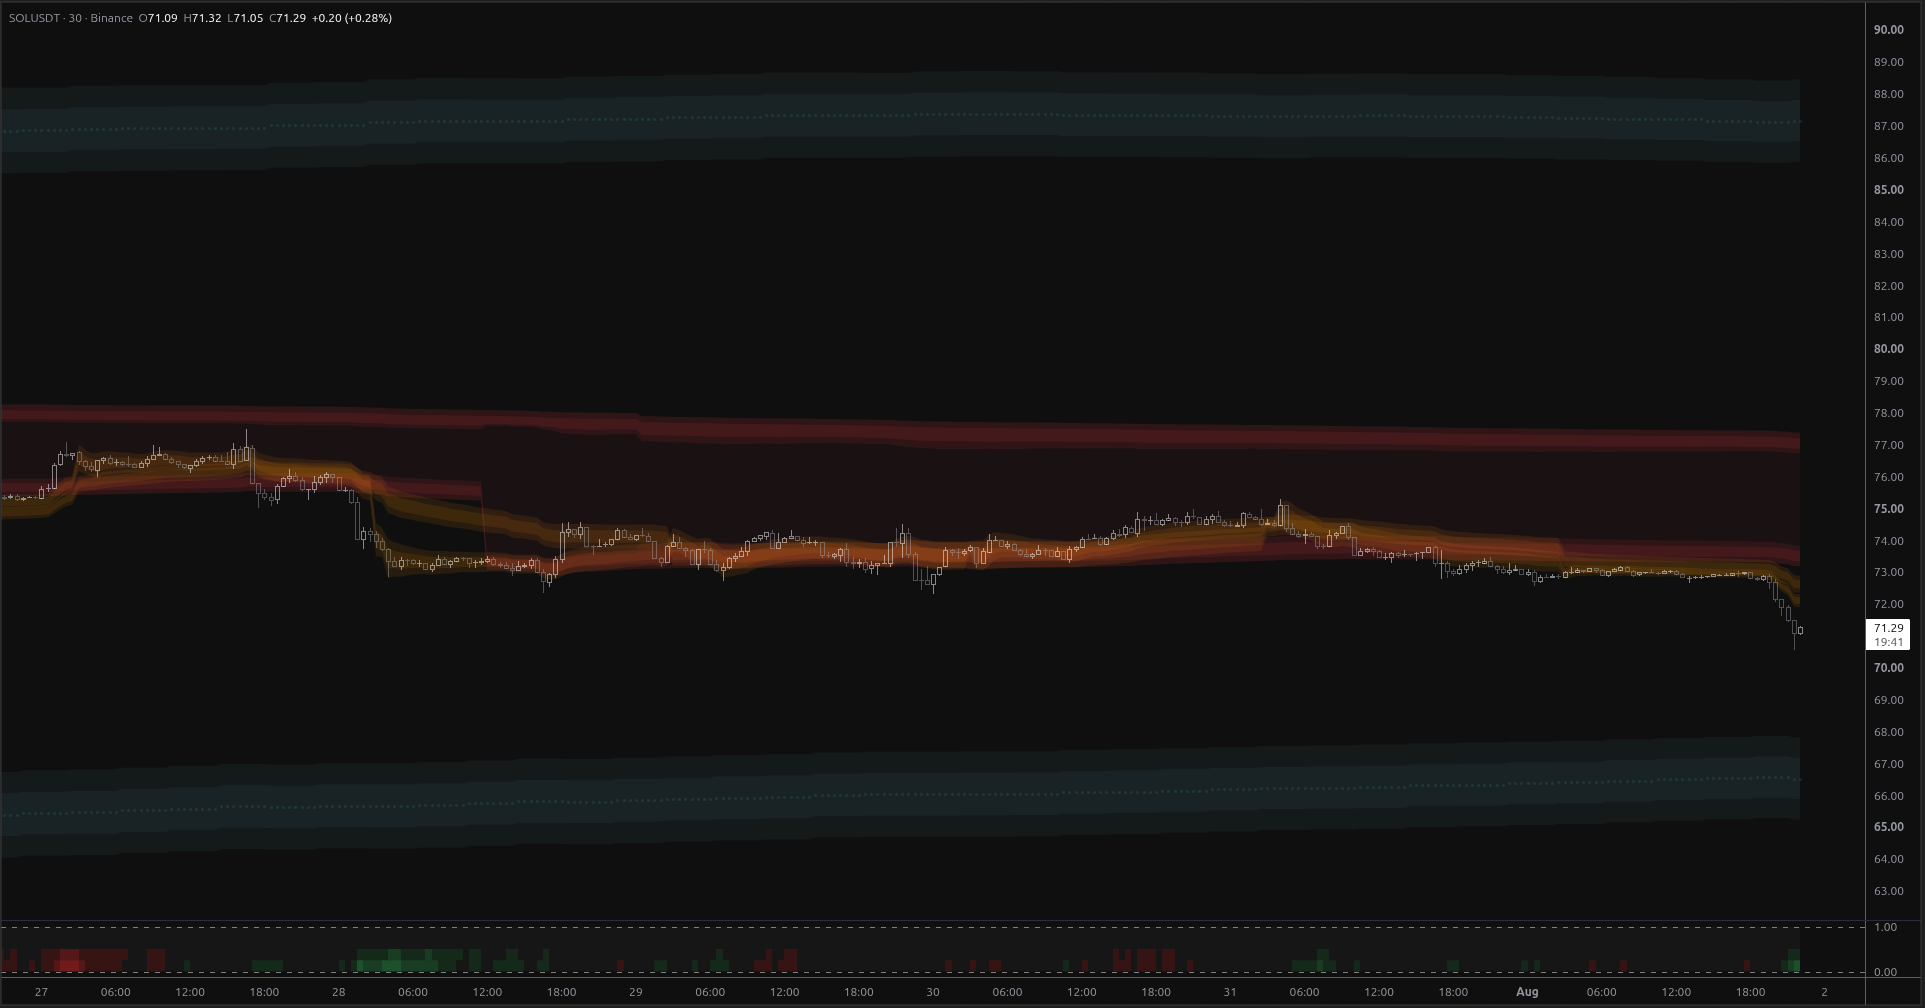
SOLUSDT Breaks Its Coil — Eyes on $67.97
SOLUSDT has broken a multi-day coil to the downside on 5x volume, falling out of every anchored envelope. With no structural support until the below_1 band at $67.97, the path of least resistance is lower.
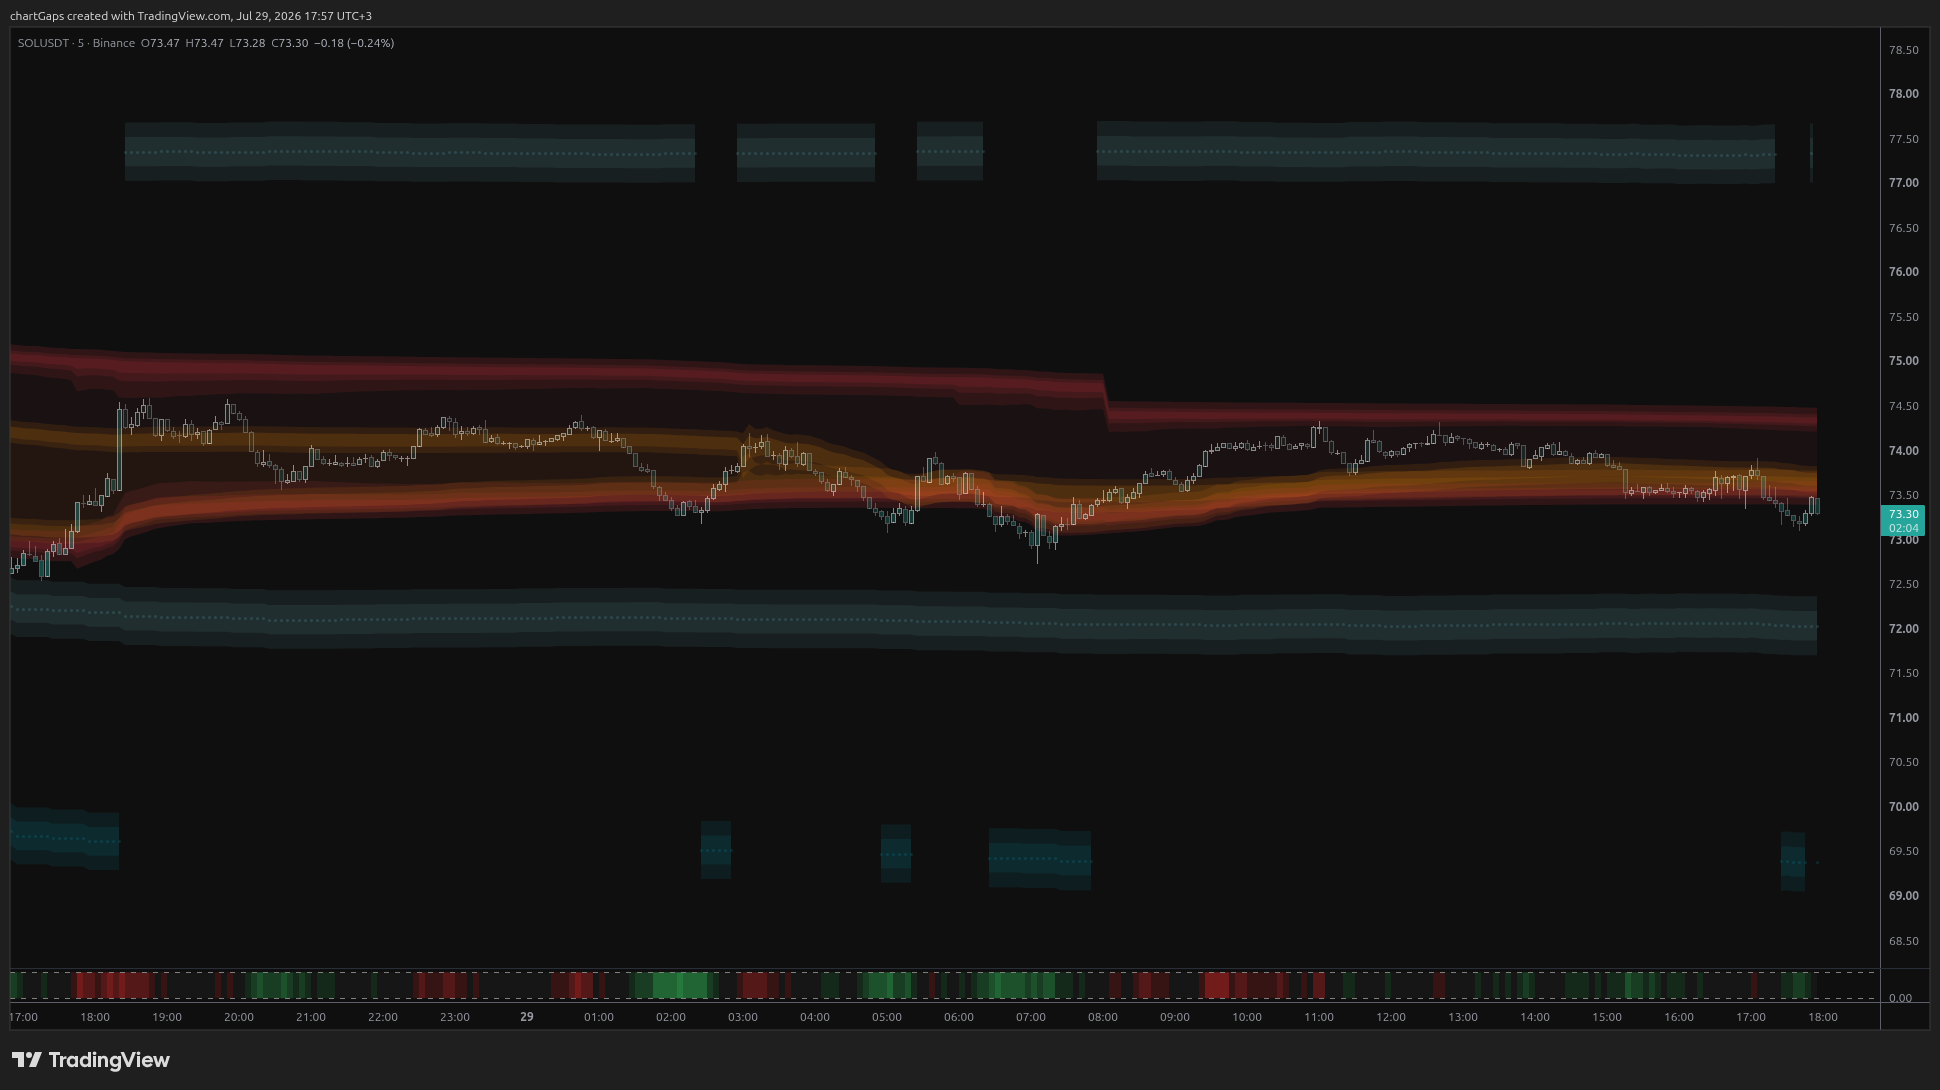
SOL Coils Below Its 200-Bar Centre: Distribution
SOLUSDT sits at $73.48, floating in the MSL centre gap for 485 bars with bearish regime at 0.94 and distribution at 1.00. Bounces into $73.63-$73.84 look like supply; untested below_1 at $72.39-$71.74 is the unfinished business.
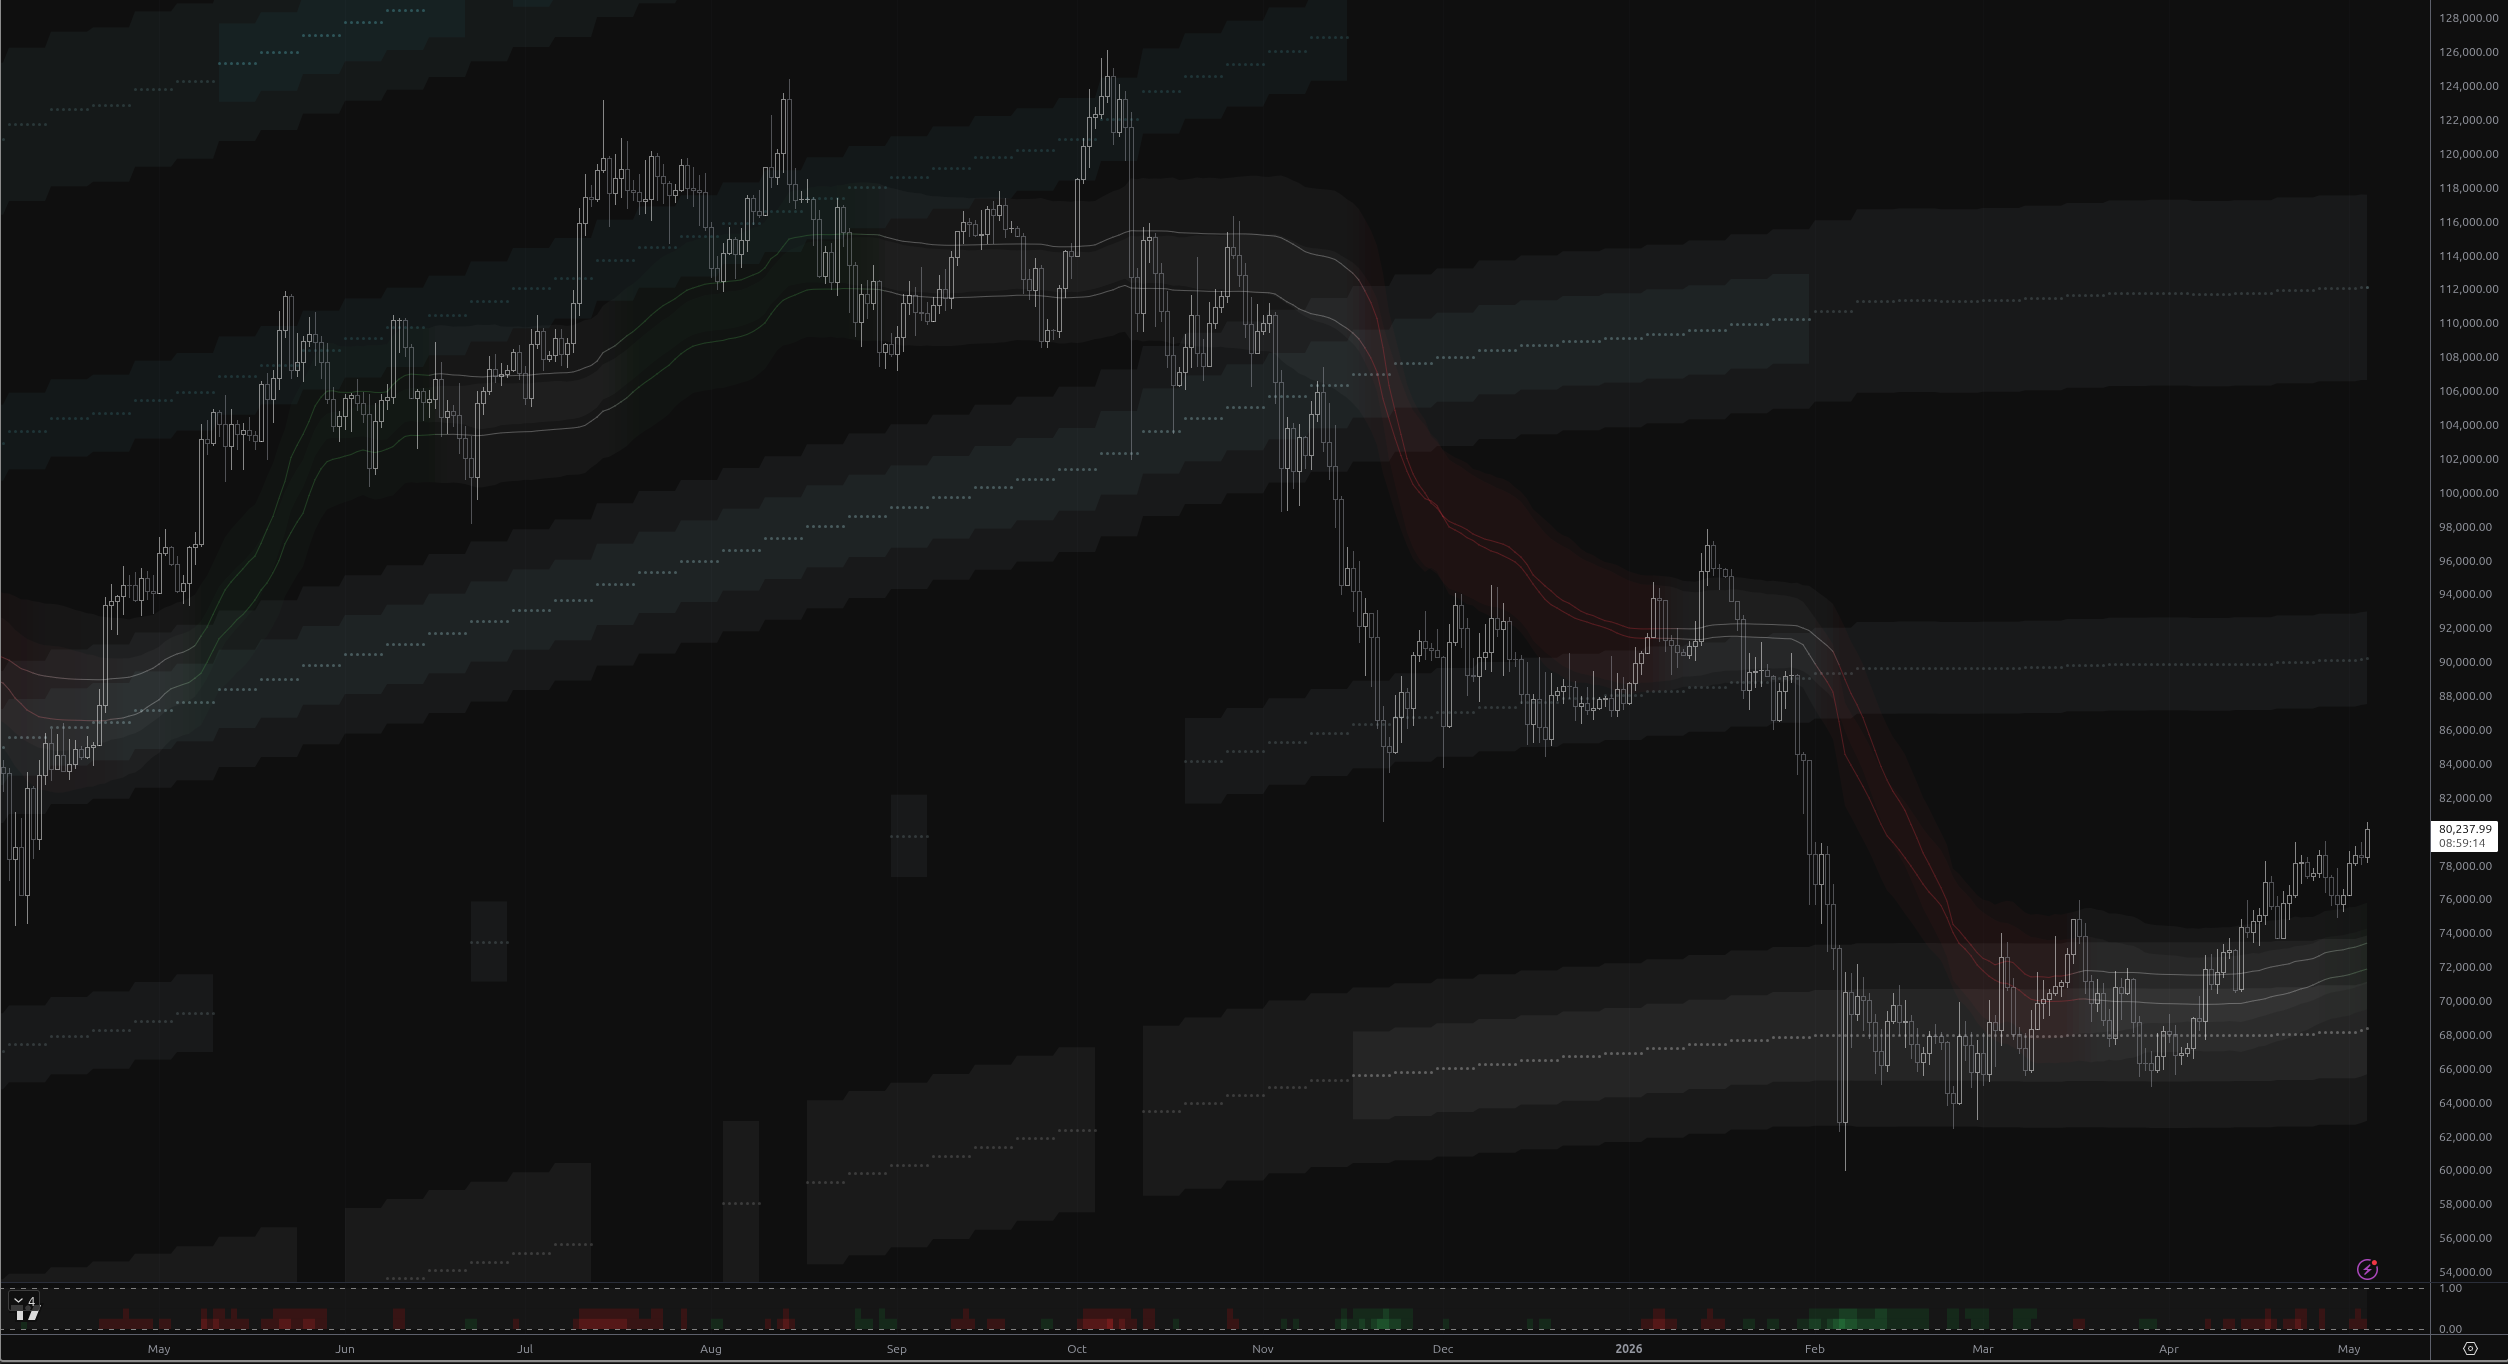
BTC at Critical Breakout Level
BTC closes at $80,482 after breaking the base band ceiling at $73,956, with five consecutive non-rejected closes signaling potential rotation toward the above_1 band ($84,883–$95,811).
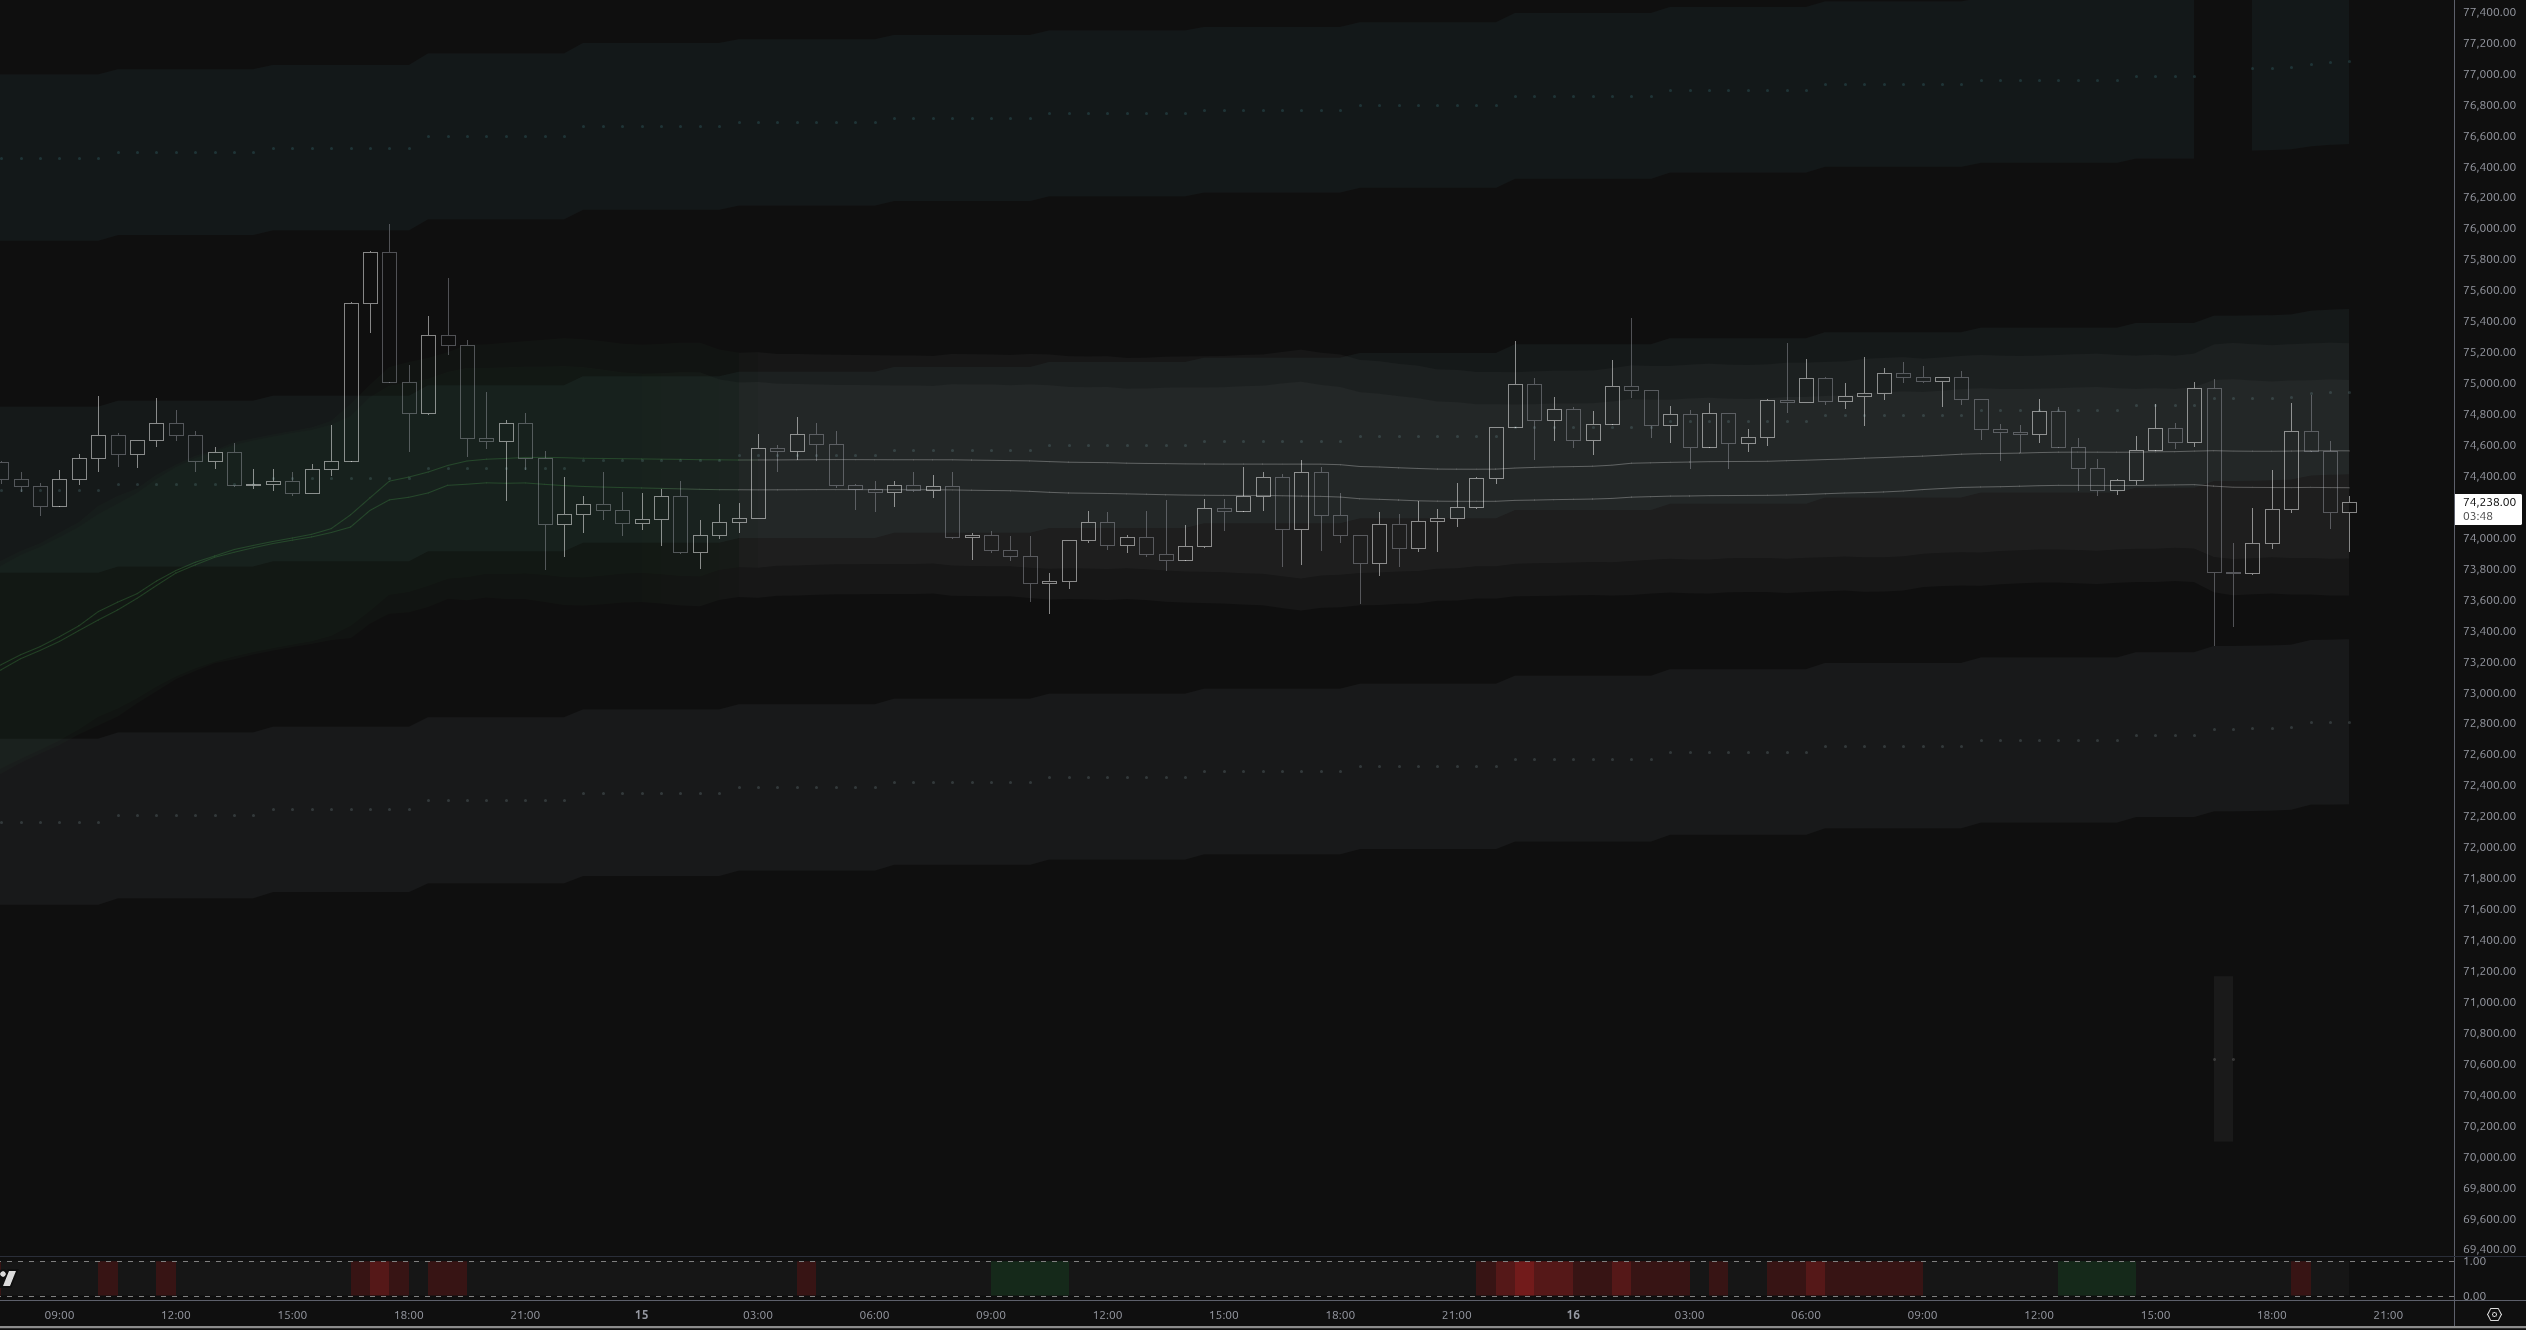
BTC at $74.7K: Distribution Phase Tests Key Band
BTC trapped in above_2 band for 96 bars amid distribution. Sharp recovery to $74.7K faces heavy resistance at $75K.
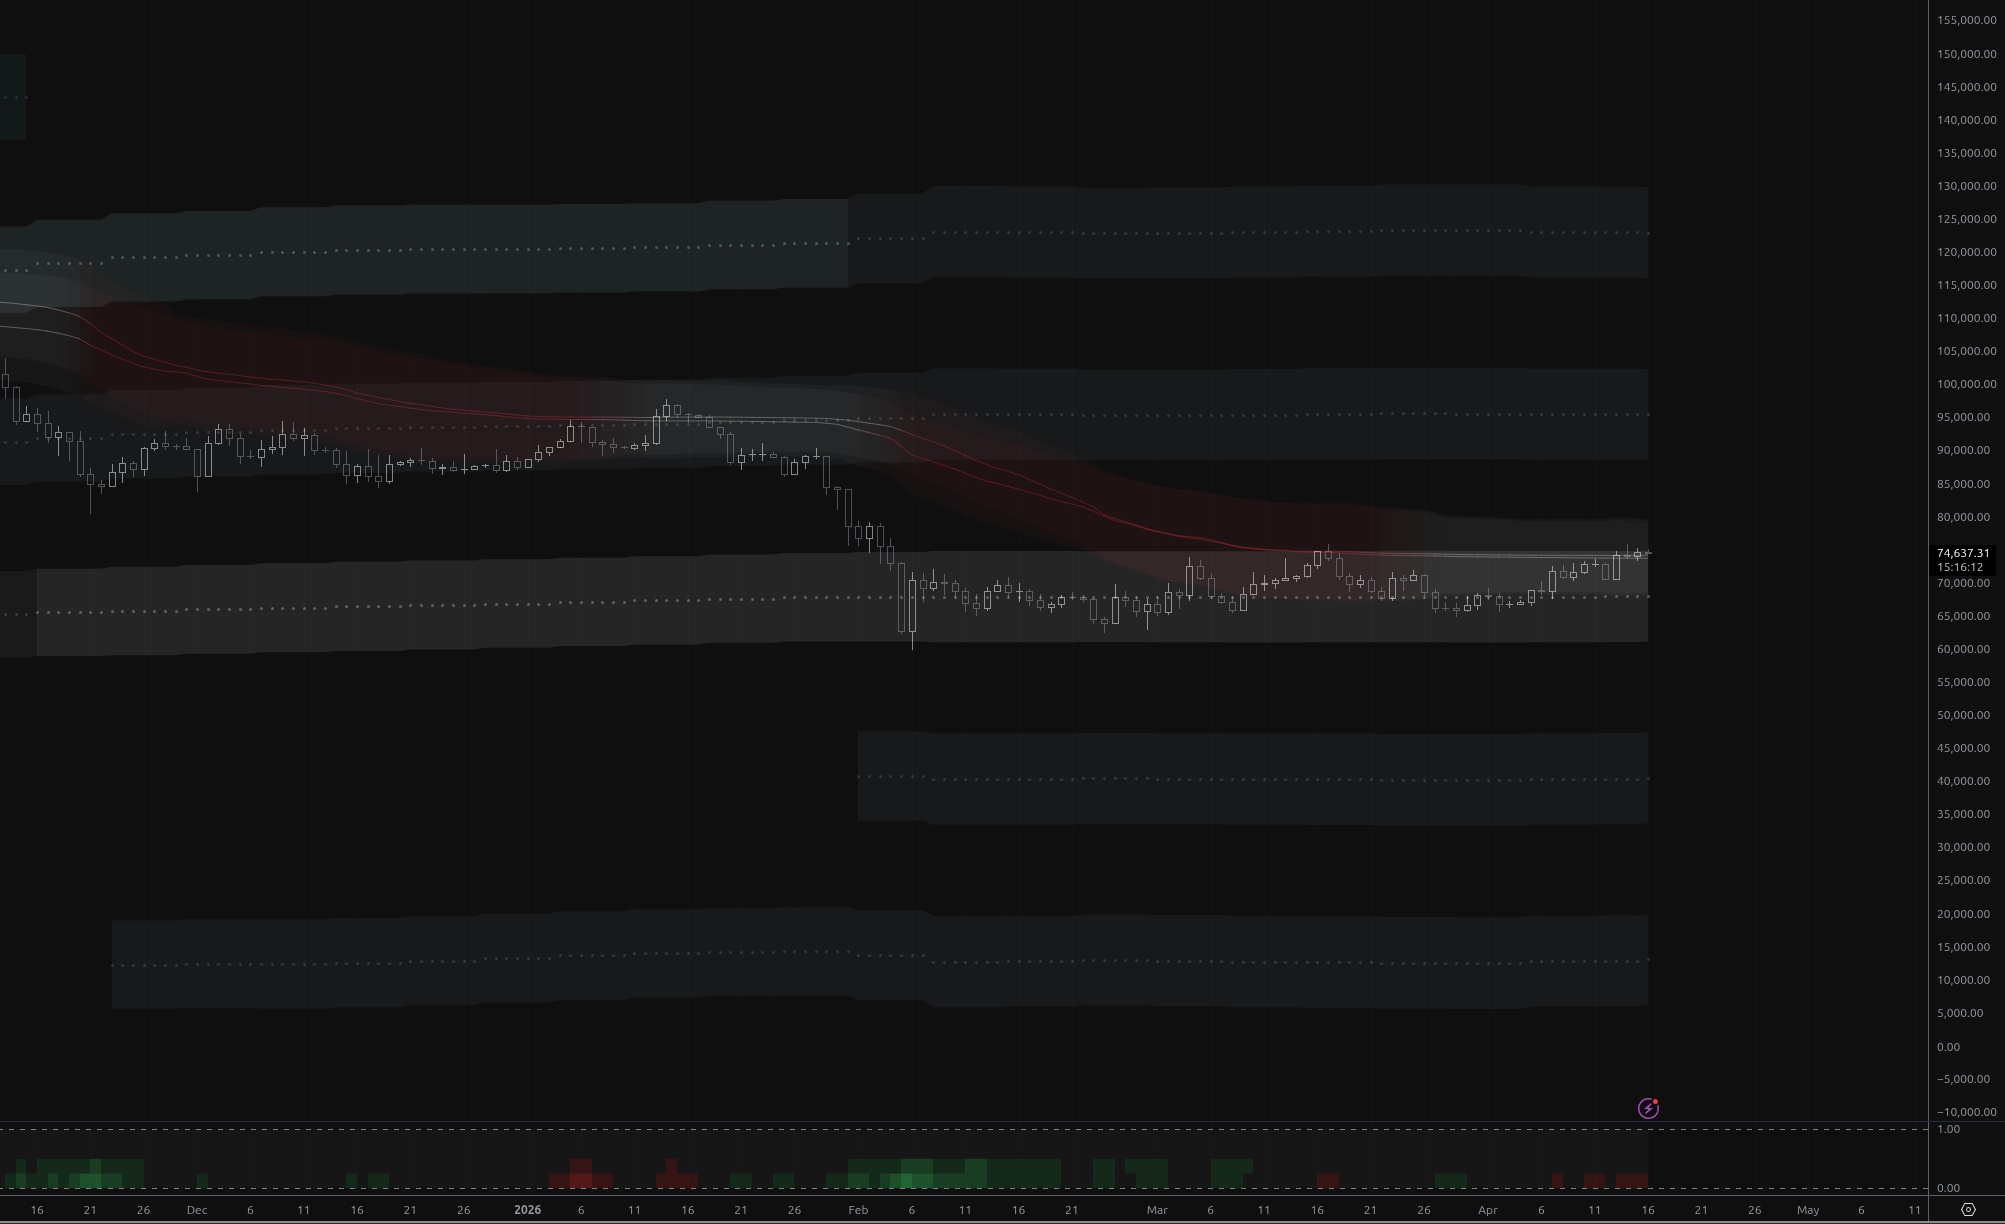
Bitcoin Testing the Ceiling of the Base Band
Bitcoin tests the $75,009 base band ceiling for the second time in three days, but collapsing volume (0.22x average), a mild bearish regime, and persistent distribution state suggest this rally faces significant headwinds
The content on this page is for educational and informational purposes only and does not constitute financial advice. We are not licensed financial advisors or professional traders. Trading involves substantial risk of loss and is not suitable for every investor. Past performance is not indicative of future results. Always do your own research and consult a qualified financial professional before making any investment decisions.
Want the Full Edge?
Start your free trial and unlock all premium indicators today.
Connect With Us
Join our community of traders and stay updated with our latest tools and market insights.