
BTCUSDT: Breakout Into Open Structural Air
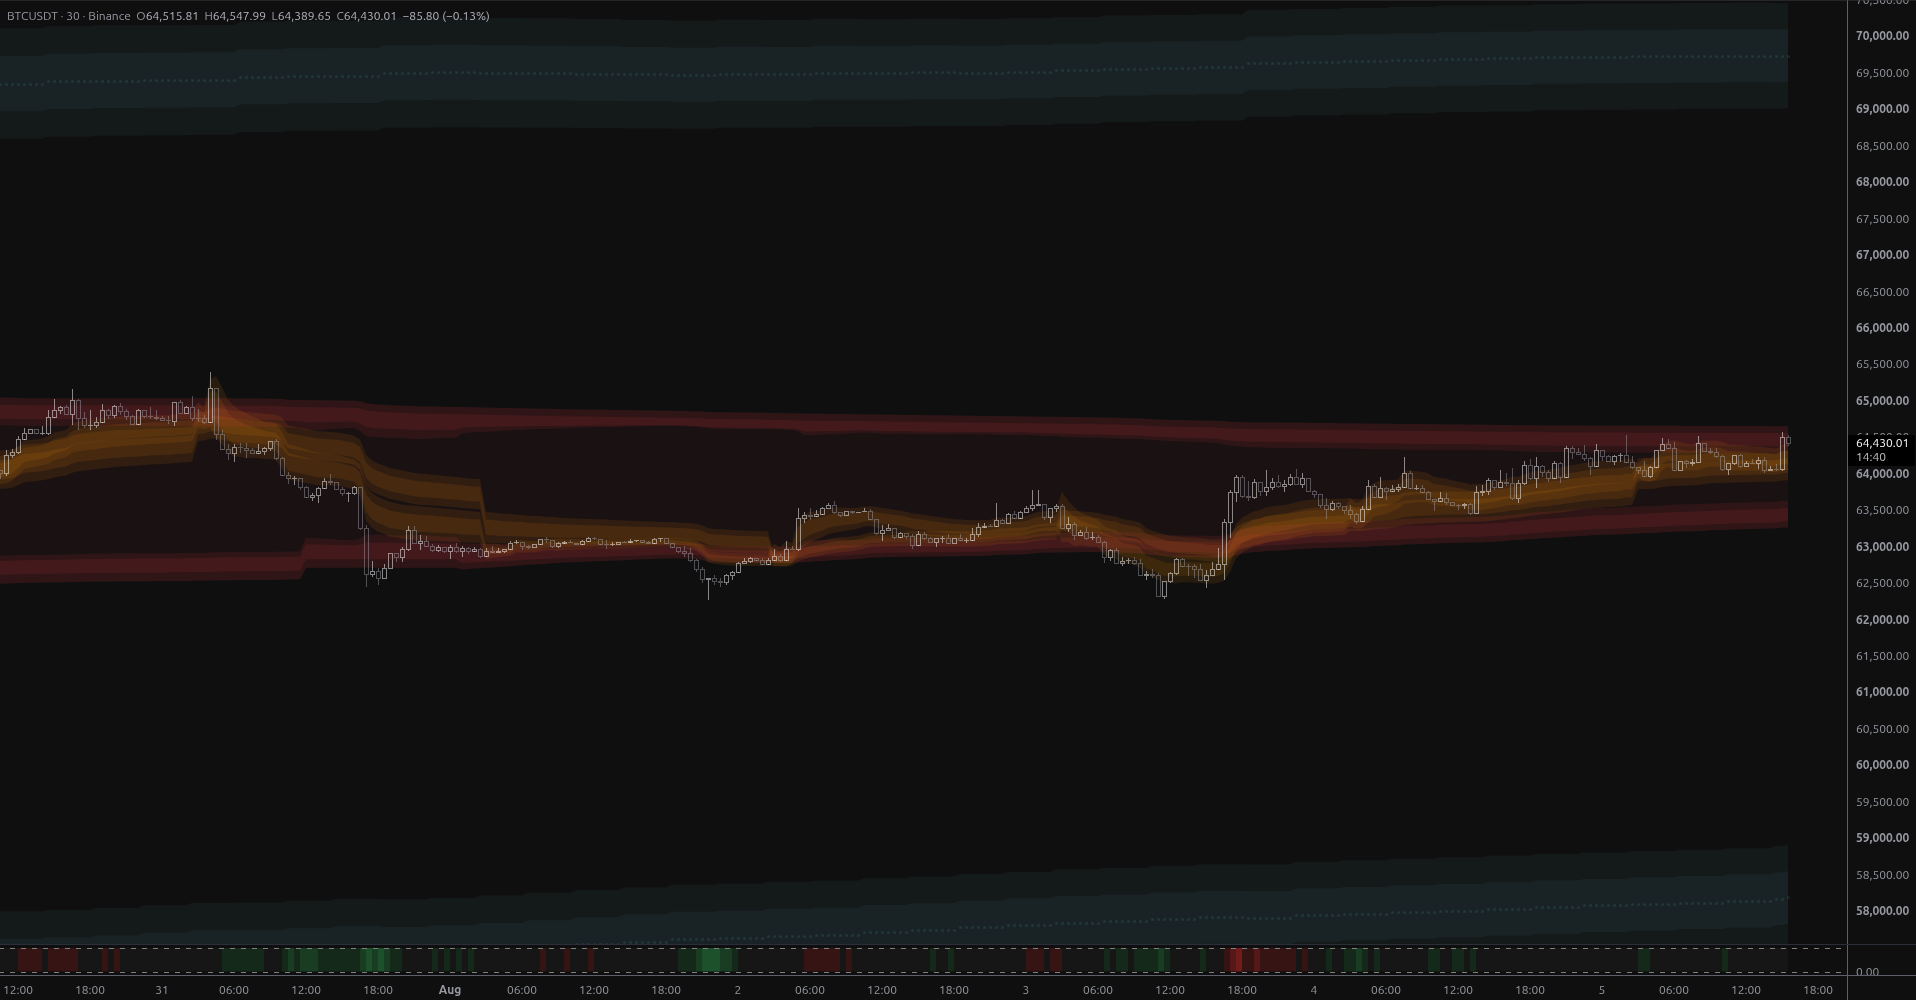
BTCUSDT broke above week-scale anchored value on 2.7x volume, leaving it stranded in structural open air with the nearest MSL band 6.8% overhead at $68,925 and no support until $59,012.
The content on this page is for educational and informational purposes only and does not constitute financial advice. We are not licensed financial advisors or professional traders. Trading involves substantial risk of loss and is not suitable for every investor. Past performance is not indicative of future results. Always do your own research and consult a qualified financial professional before making any investment decisions.
Executive Summary
BTCUSDT is trading at $64,515.81 on the 30-minute chart after a high-volume expansion bar that printed a session high of $64,581.43 on roughly 2.7x average volume — the heaviest bullish participation in dozens of bars. That single candle did three things at once: it took out the prior swing high at $64,549.16, it lifted price above the entire weekly anchored value envelope for the first time in this leg, and it pushed price into the upper band of the pivot-anchored envelope. Meanwhile, the MSL structural grid shows price stranded in open air: the nearest band, above_1 ($68,925.71–$70,341.84), sits some 6.8% overhead, and the next structural shelf below does not begin until $59,012.84, 8.53% lower.
The regime model reads bullish with high conviction, and the structural classifier has held support base for 56 consecutive bars — a base that has now been resolved upward rather than downward. That combination argues for continuation-with-retest as the primary path, not a top.
Trend Overview: A Staircase, Not a Spike
The data window traces a clean rotation from distribution into accumulation into markup. Price bottomed near $62,275–$62,326, spent a long stretch grinding sideways in the $62,500–$63,200 area, then began a persistent staircase advance:
- Swing lows: $62,326 → $63,451.80 → $63,950.00
- Swing highs: $63,927 → $64,243.81 → $64,549.16 → $64,581.43 (current)
The swing engine labels this an uptrend (higher highs + higher lows), and the chart geometry supports it: a shallow, rising channel with repeated shallow pullbacks that never surrendered the prior breakout shelf. Each pullback has been absorbed within about 0.5–0.8% of the highs, which is the signature of trend-following demand rather than distribution.
Importantly, the advance has been slow and overlapping, not vertical. That matters for the outlook: staircase trends inside structural voids tend to persist far longer than impulse spikes, because they never generate the kind of stretch that invites a violent mean-reversion snap.
Anchored Value: Both Envelopes Now Aligned Bullish
Week-scale anchored envelope (avwap@anchor)
This is the slower, more stable read on value. Its top rail sits at $64,129.86, with the upper centre line at $63,925.92 and the lower structure at $63,930.25 / $63,718.13 / $63,522.36. The current close is above the entire envelope — the zone flipped up on this bar. Price had been oscillating in and around the top band for the last several sessions, repeatedly poking above and falling back; this bar is the first decisive separation.
The practical read: $64,129.86 is now the line that defines whether this is a breakout or a failed poke. Sustained trade above it keeps the week-scale view constructive; a close back beneath it returns price to the interior of value and neutralises the move.
Pivot-anchored envelope (avwap@pivot)
This channel has been running for well over 160 bars without re-anchoring, which makes it an unusually well-established reference rather than a fresh, fragile one. Price now sits inside the top band at roughly 0.89 of the way across the full envelope — stretched, but not outside it. The relevant rails:
- Top band: $64,312.59 (lower rail) → $64,484.72 (centre) → $64,673.32 (upper rail)
- Bottom band: $63,272.68 (lower rail) → $63,436.33 (centre) → $63,633.41 (upper rail)
The nearest overhead friction in the whole dataset is therefore $64,673.32, the outer rail of the pivot envelope. That is the first genuine test of the breakout. Above it, there is no anchored resistance left in the window at all — which is precisely why the MSL void above becomes the operative framework.
MSL Structure: The Void Is the Story
The MSL grid is the longer-horizon map, and right now it is telling a very specific story: price is between bands, not at one.
| Band | Range | Distance from spot | Role |
|---|---|---|---|
| above_2 | $74,590.16 – $76,006.34 (mid $75,298.28) | +15.62% (to lower edge) | Extended cycle objective |
| above_1 (nearest band) | $68,925.71 – $70,341.84 (mid $69,633.77) | +6.83% (to lower edge) | Primary structural magnet above |
| Open air | $59,012.84 – $68,925.71 | current location | Trend-travel zone |
| Band below | $57,596.71 – $59,012.84 (mid $58,304.77) | -8.53% (to upper edge) | Structural floor if the trend fails |
Two observations from the band history in this window. First, the nearest-band label has migrated upward — earlier bars were classified against the lower shelf, and the label flipped up 57 bars ago and has held since, with position in band pinned at the extreme and then outside. That migration is the structural fingerprint of a market climbing through the grid rather than rotating within one band. Second, the repeated "tests" of the above_1 lower edge listed in the level data are proximity references, not genuine touches — closes in the $64,000s against an edge at $68,918–$68,925 are nowhere near contact. There has been no rejection at above_1 because price has not reached it.
The strategic implication: in a structural void, band-to-band travel is the default expectation. The market has committed to the upper half of the void. The unfinished business is above_1's lower edge at $68,925.71, then its midline at $69,633.77.
Regime and Structural Context
The regime classifier reads bullish with maximum conviction and has recently cycled through strong-bullish readings during the impulse legs, with only brief neutral and mild-bearish interludes during the $62,300–$62,800 basing phase. Crucially, the mild-bearish stretch coincided exactly with the lows — the model was capitulating as the base completed, and it has been bullish ever since. New shorts are the wrong side of this regime.
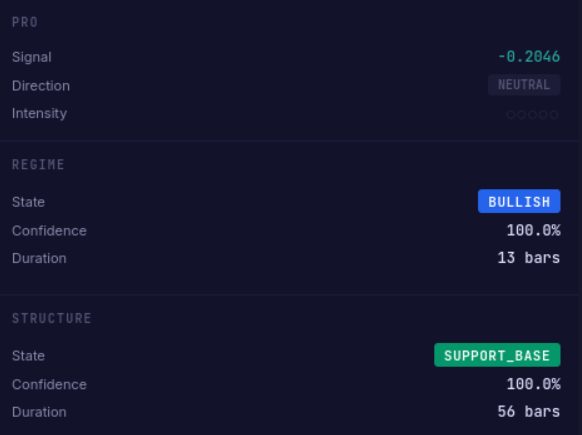
The structural classifier is the more interesting tell. The sequence in this window reads: distribution → exhaustion → resistance cap → support base, with support base now holding for 56 straight bars. In other words, the market spent the earlier part of the window capped and exhausted near the top of its range, broke that ceiling, and has since been treating the former ceiling as a floor. Support base with an intact higher-high/higher-low sequence is the highest-quality continuation configuration this framework produces.
Momentum and Participation
The PRO rejection oscillator reads essentially flat and neutral (-0.20, falling, zero intensity), with a compressed range across the window. This is neither confirmation nor warning — it is the absence of exhaustion. Notably, PRO printed persistent oversold readings into the pullback lows (a textbook continuation signal inside an uptrend) and has not generated a meaningful overbought stretch on this breakout. The absence of an overbought rejection print on a 2.7x volume expansion bar is constructive; it suggests the move was bought, not sold into.
Volume is the strongest single piece of evidence here: 789 units against a recent average near 212. Prior expansion bars of this magnitude in the window (the 1,328-unit bar that launched the move off $63,400) preceded multi-hundred-dollar advances.
Scenarios, Most to Least Likely
1. Breakout retest and grind higher (most likely)
Price tests the pivot envelope's outer rail at $64,673.32, pulls back to the newly reclaimed week-scale rail at $64,129.86 or the pivot top-band lower rail at $64,312.59, holds, and resumes. This preserves the higher-low sequence above $63,950.00. Path forward: clearance of $64,673.32 opens unobstructed void travel toward the $65,000–$66,000 region with the structural objective at above_1's lower edge, $68,925.71, and the band midline $69,633.77 as the fuller measured target. Supporting evidence: bullish regime, 56-bar support base, upward band migration, volume expansion, no momentum exhaustion.
2. Failed poke and rotation back into value (second most likely)
The expansion bar proves to be a liquidity grab above $64,549.16. Price closes back beneath $64,129.86, re-enters the week-scale envelope, and rotates down through the pivot envelope toward its centre at $64,484.72 — and if that fails, toward the pivot bottom band at $63,633.41 → $63,436.33 → $63,272.68. This is a range outcome, not a trend reversal, provided $63,451.80 (prior swing low) holds. The uptrend structure would still be intact; the market would simply need more time in the base. Watch for a long upper wick on the following bars and a collapse in relative volume as the signature.
3. Structural failure toward the lower shelf (least likely)
Loss of the pivot envelope's lower rail at $63,272.68 followed by a break of the $62,326 swing low would invalidate the higher-low sequence entirely and flip the structural read from support base back toward distribution. In that case the void works against longs: there is no MSL support until the band below at $59,012.84 (upper edge), with the midline at $58,304.77. That is an 8.5%+ air pocket, and voids cut both ways — downside travel through them is fast. This requires the regime model to break down from a maximum-conviction bullish reading, which is why it ranks last, but the magnitude of the move if it happened is why it must be respected.
Key Levels
| Level | Price | Source |
|---|---|---|
| Extended objective | $75,298.28 | MSL above_2 midline |
| Extended objective | $74,590.16 | MSL above_2 lower edge |
| Structural target | $70,341.84 | MSL above_1 upper edge |
| Structural target | $69,633.77 | MSL above_1 midline |
| Primary upside magnet | $68,925.71 | MSL above_1 lower edge |
| First resistance | $64,673.32 | Pivot envelope outer rail |
| Session high | $64,581.43 | Current bar high |
| Prior swing high | $64,549.16 | Swing structure |
| Pivot fair value | $64,484.72 | Pivot envelope centre |
| Near support | $64,312.59 | Pivot top band lower rail |
| Breakout pivot | $64,129.86 | Week-scale envelope top rail |
| Support | $64,020–$64,050 | Recent bar lows |
| Week-scale value | $63,925.92 | Week anchored centre |
| Last swing low | $63,950.00 | Swing structure |
| Support cluster | $63,633.41 / $63,436.33 / $63,272.68 | Pivot bottom band |
| Trend invalidation | $63,451.80 | Prior swing low |
| Structural invalidation | $62,326 | Base low |
| Structural floor | $59,012.84 | MSL band below, upper edge |
| Structural floor | $58,304.77 | MSL band below, midline |
What to Watch Next
- Does the week-scale envelope hold as support? The single most informative datapoint over the next several bars is whether $64,129.86 is defended on a pullback. Reclaimed-rail-as-support is the mechanism that converts a poke into a trend leg.
- Volume follow-through. A 2.7x expansion bar needs company. If the next expansion bars are bearish and larger, the breakout is being distributed into.
- PRO behaviour on the pullback. Oversold prints during a retracement inside this uptrend would be continuation confluence. Overbought prints appearing with stalling price near $64,673.32 would warn of a failed extension.
- Structural state persistence. If the 56-bar support base transitions to breakout, the framework is confirming void travel. A shift to resistance cap or distribution near $64,673 would flag scenario two.
- Band migration. The MSL label has been climbing the grid. Watch for the nearest-band designation and in-band position to begin registering meaningful approach to above_1 — that is the checkpoint that the 6.8% void is actually being traversed rather than merely available.
Bottom Line
This is a market that spent a long stretch capped and exhausted, built a base beneath the former ceiling, held that base for 56 bars, and has now separated from week-scale value on the highest relative volume of the window with an intact higher-high/higher-low sequence. Every loaded framework points the same direction: the regime model is bullish, the structural classifier is in support base, both anchored envelopes have flipped to a constructive read, and the structural grid places the nearest magnet 6.8% above spot with nothing in between. The near-term question is only whether the retest is clean. The medium-term question — the one worth framing an outlook around — is whether the void between here and $68,925.71 gets crossed. Until $63,272.68 and $63,451.80 give way, the balance of evidence says it does.
This is a structural analysis, not a trade recommendation. Levels are drawn from indicator output on the stated instrument and timeframe; market conditions change and every scenario above carries an explicit invalidation for a reason.
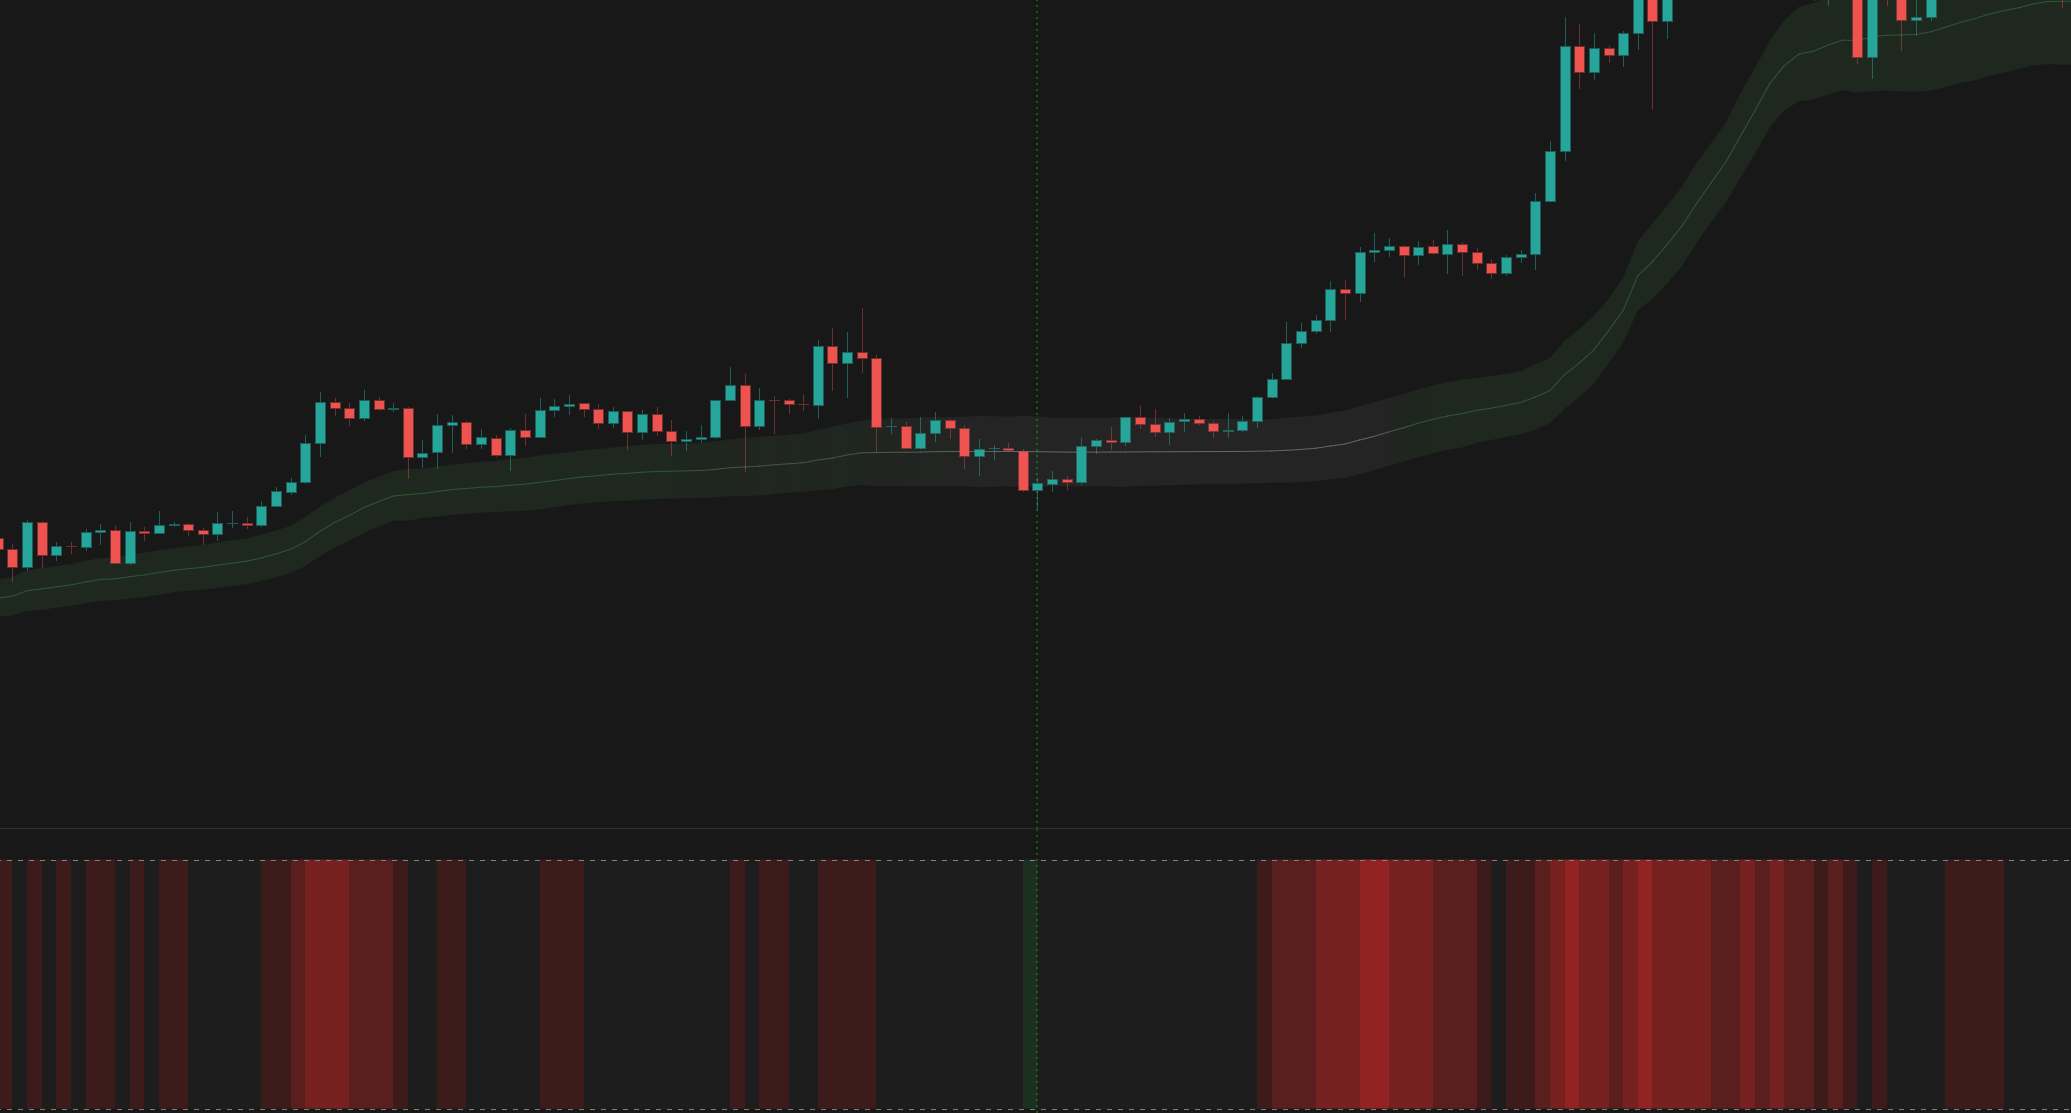
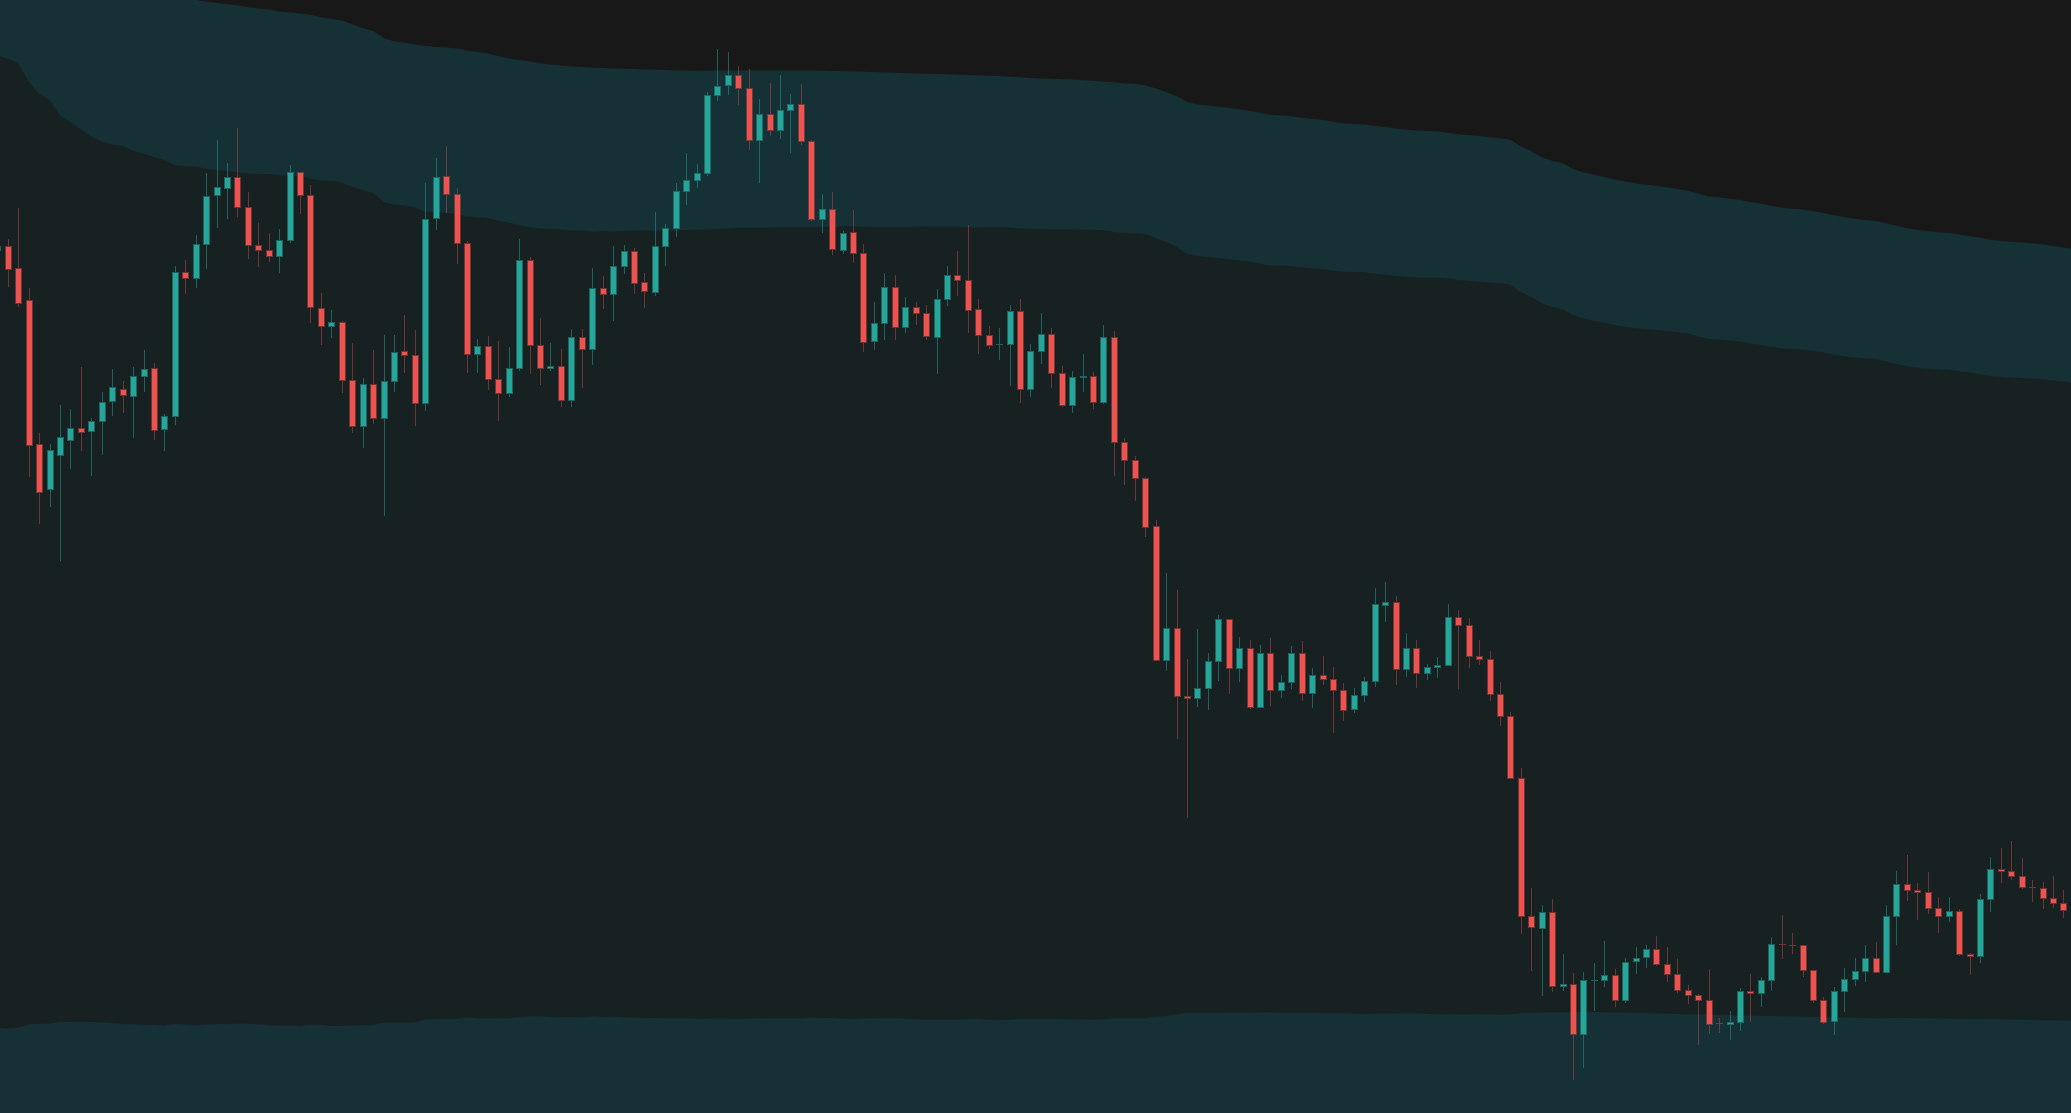
Featured Indicators
The indicators referenced in this trading idea.
Related Ideas
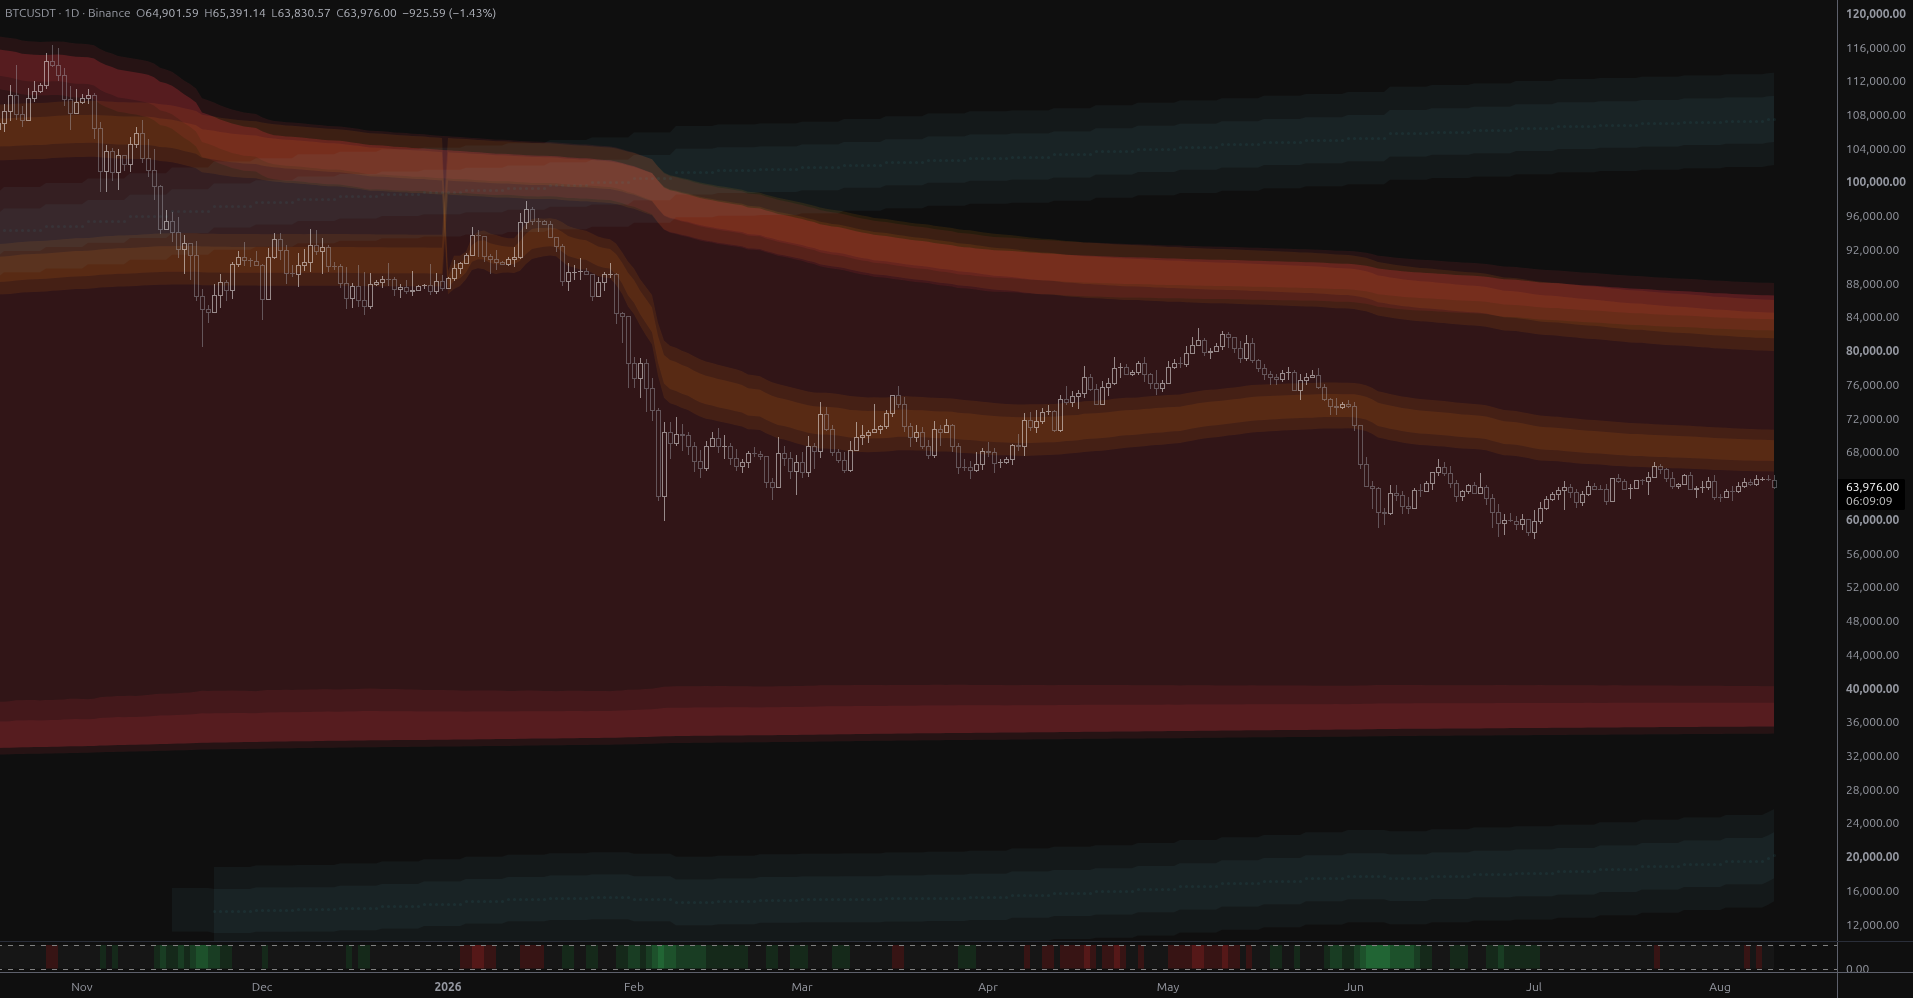
BTC Coils Just Under Its Yearly Value Rail
Bitcoin is coiling at $64,901 just 1.8% below its year-anchored value rail at $66,048, with structural bands far away in both directions. Ranked scenarios, key levels and the air pocket below $57,800.
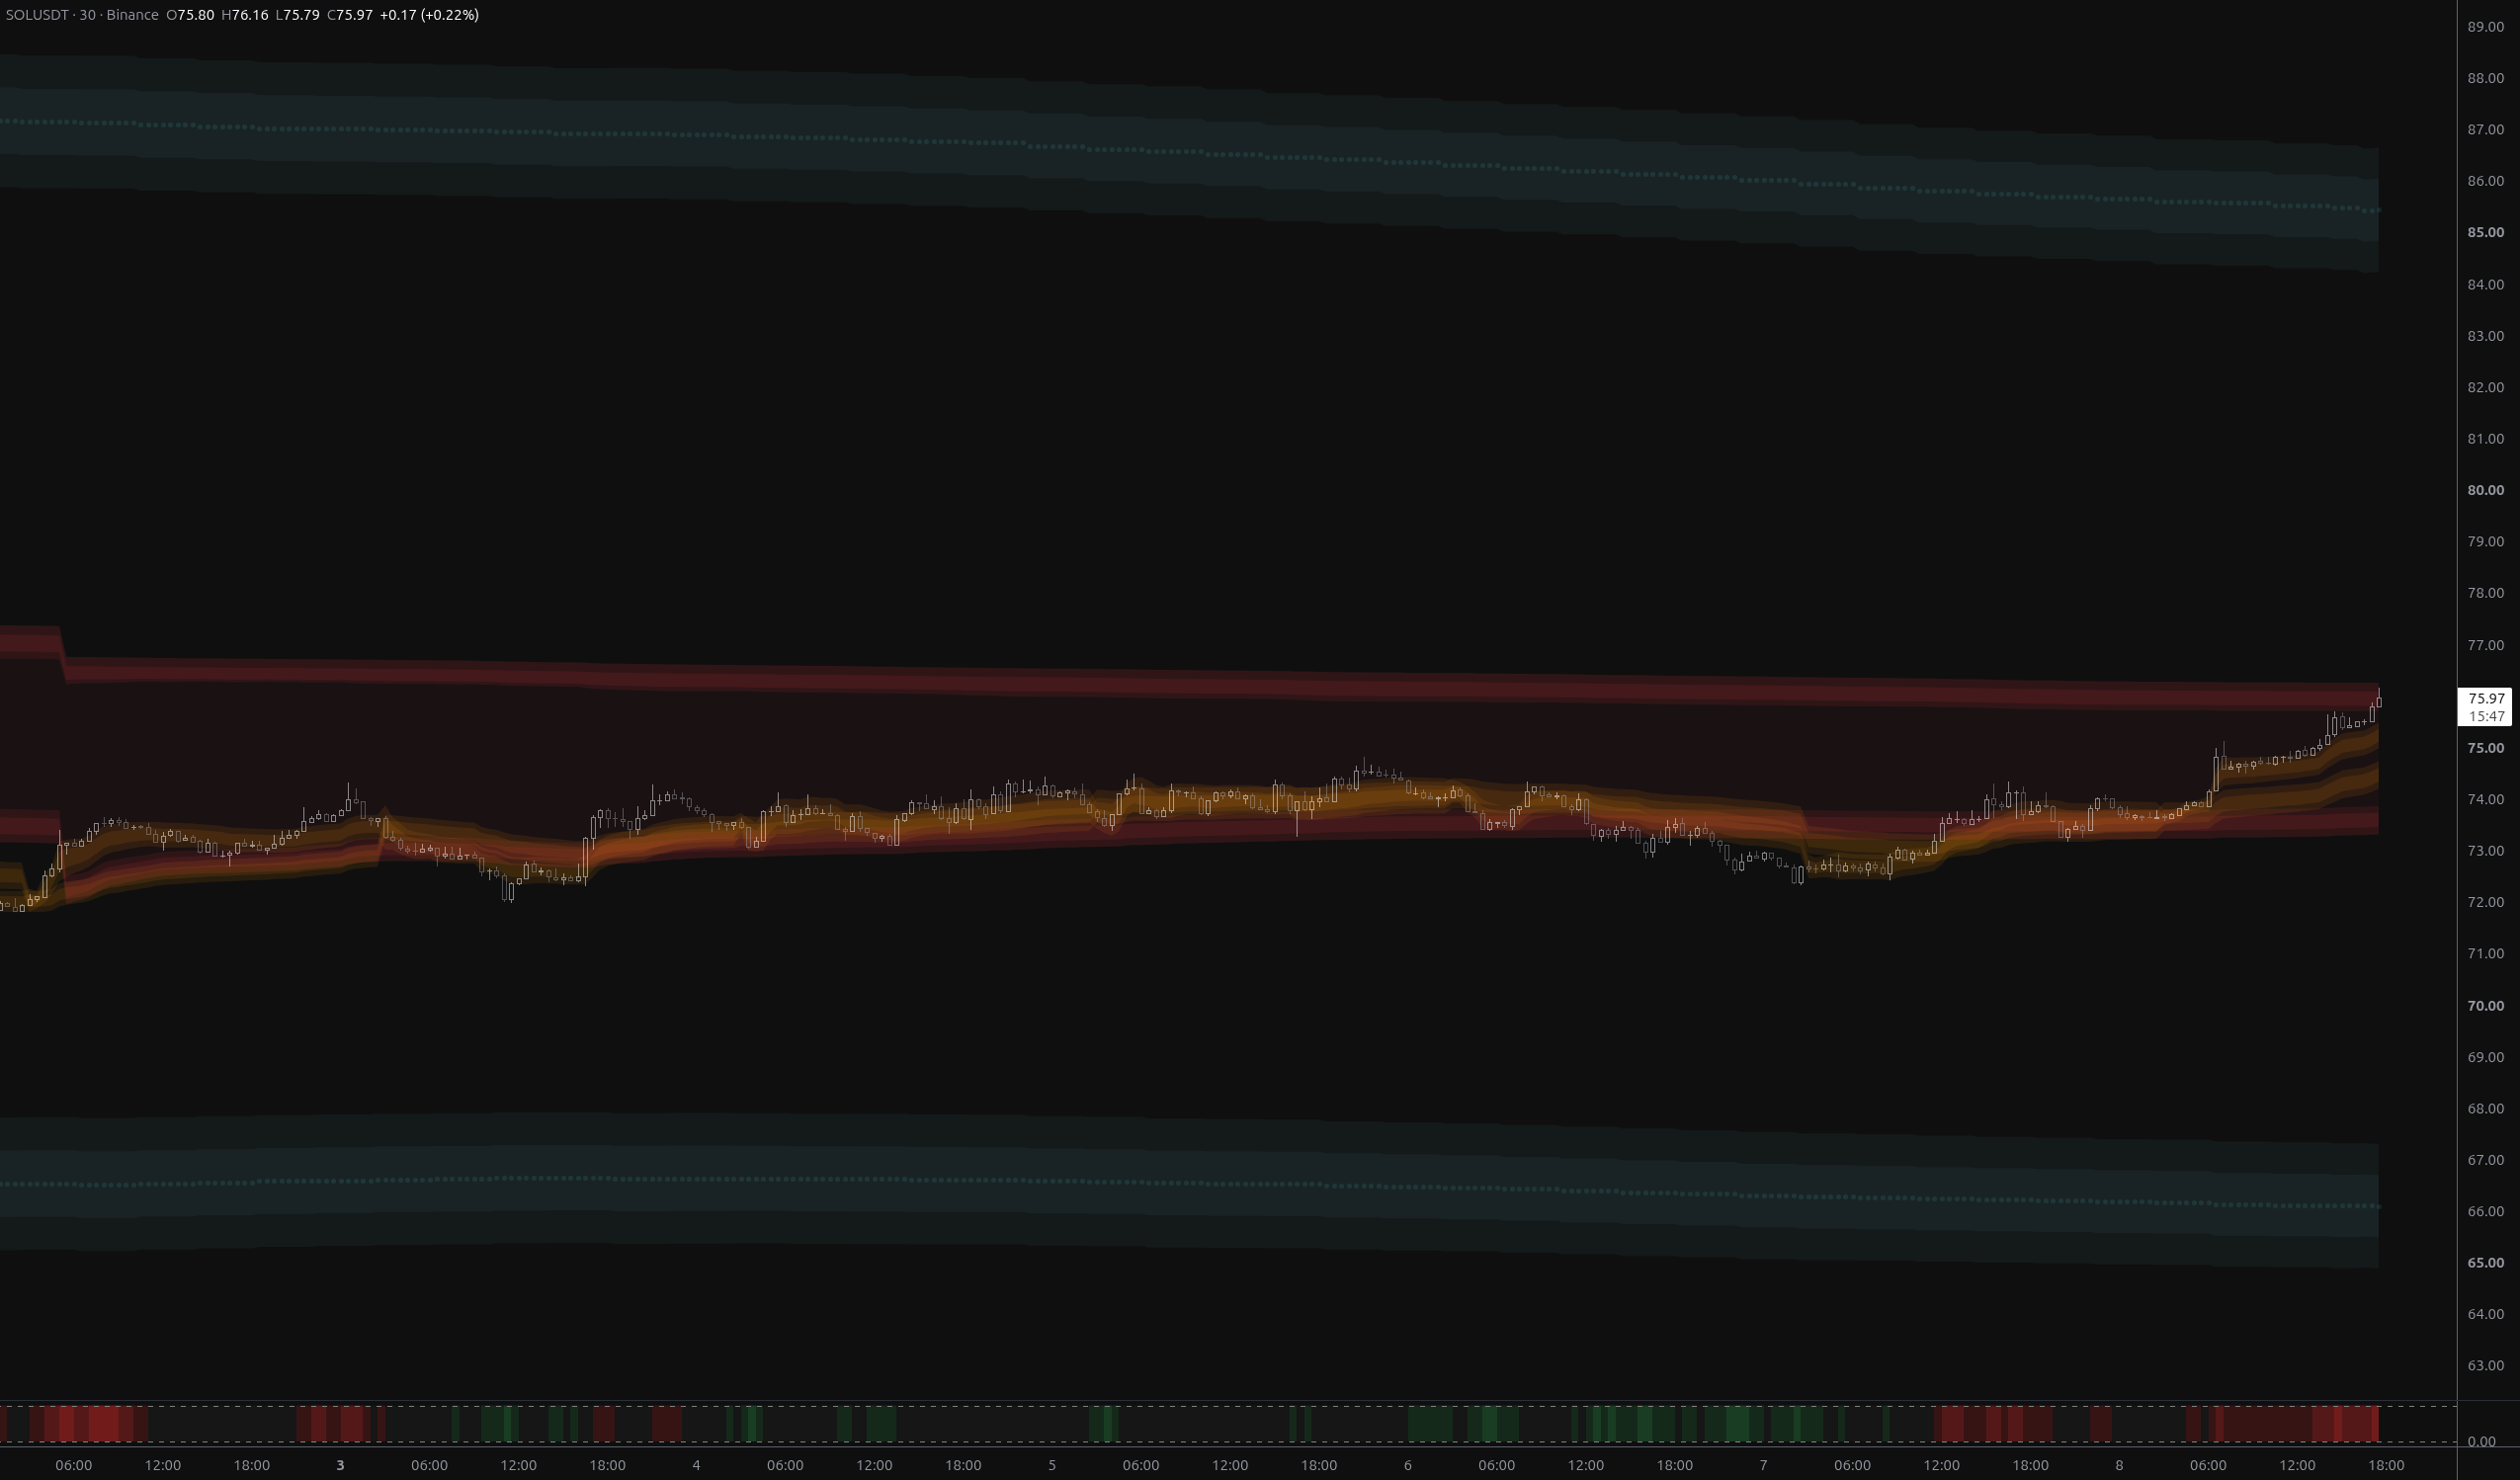
SOLUSDT: Bears Invalidated, $76.27 Now the Test
SOLUSDT has fully reversed the breakdown, reclaiming both fair-value envelopes and flipping its nearest structural band to above_1. The $75.73–$76.27 rail zone is now the decisive test.
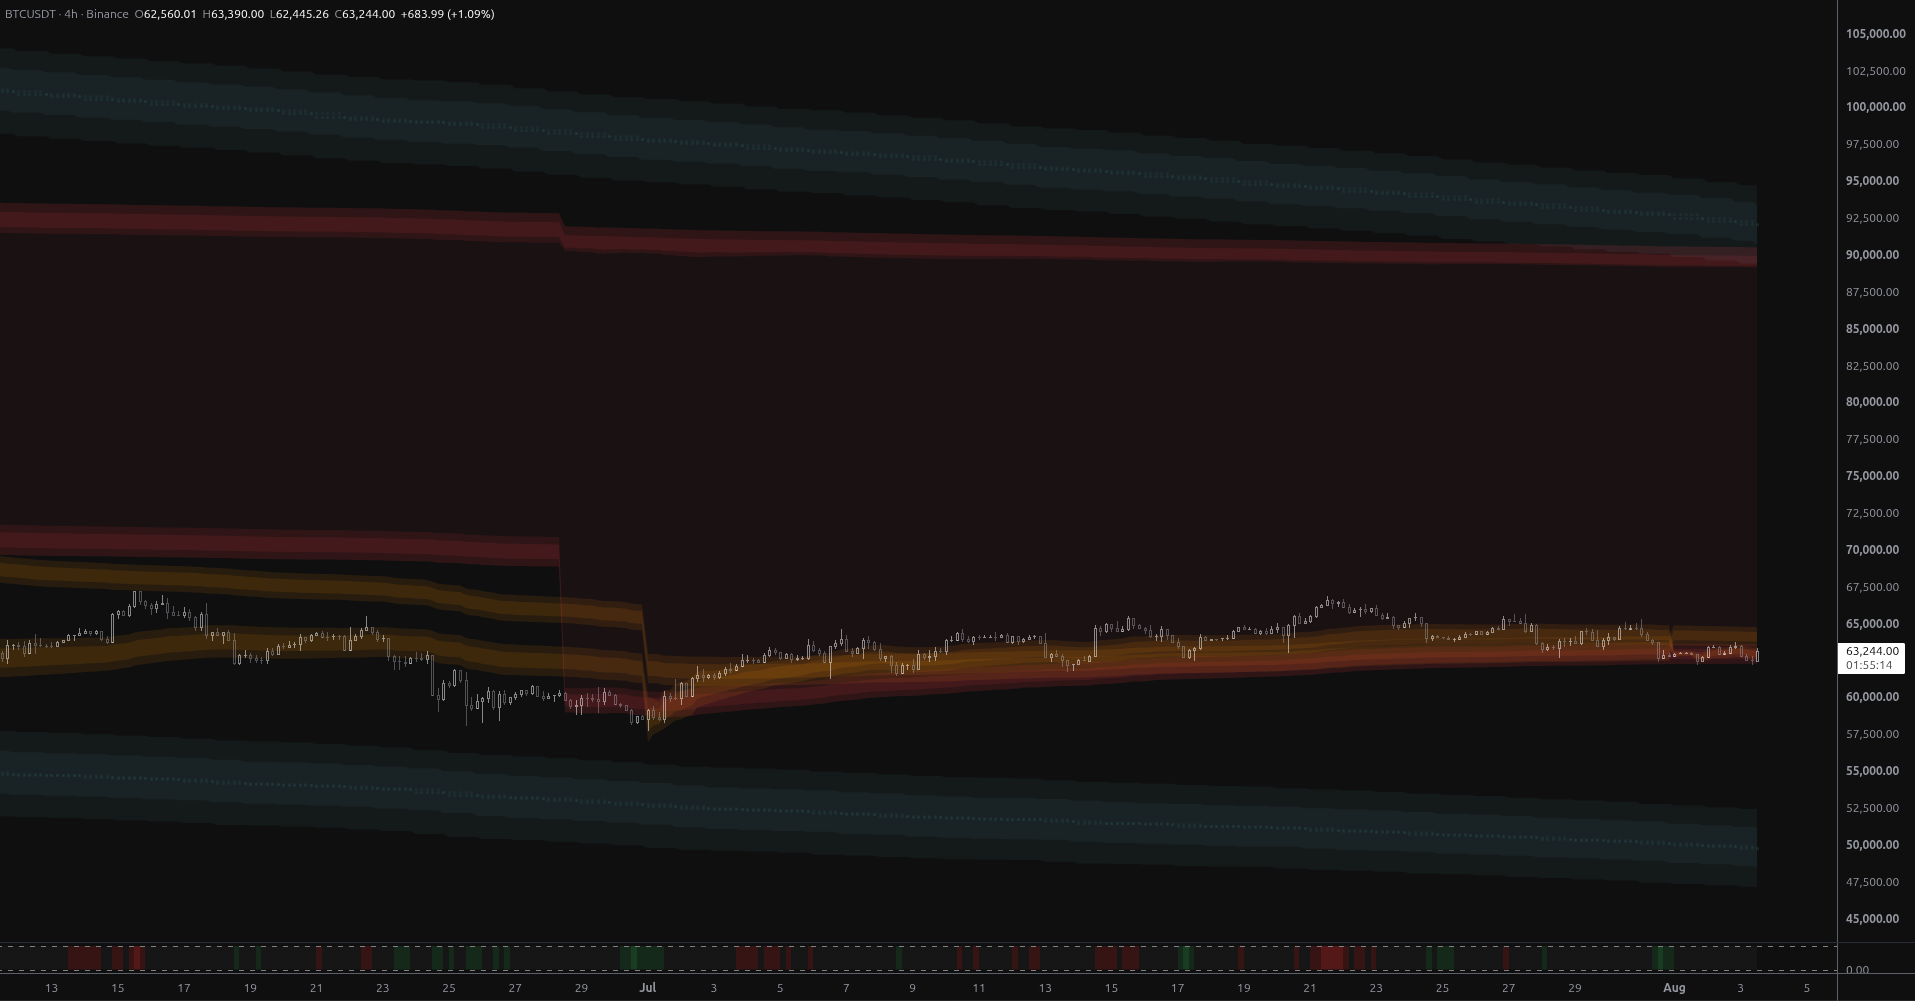
Bitcoin: Exhaustion at the Envelope Floor
BTCUSDT has rolled over from a rounded top and is grinding below its monthly anchored fair-value envelope. With no MSL structure within 16% either way, $62,335 is the level that decides the next phase.
Connect With Us
Join our community of traders and stay updated with our latest tools and market insights.