
SOLUSDT Breaks Its Coil — Eyes on $67.97
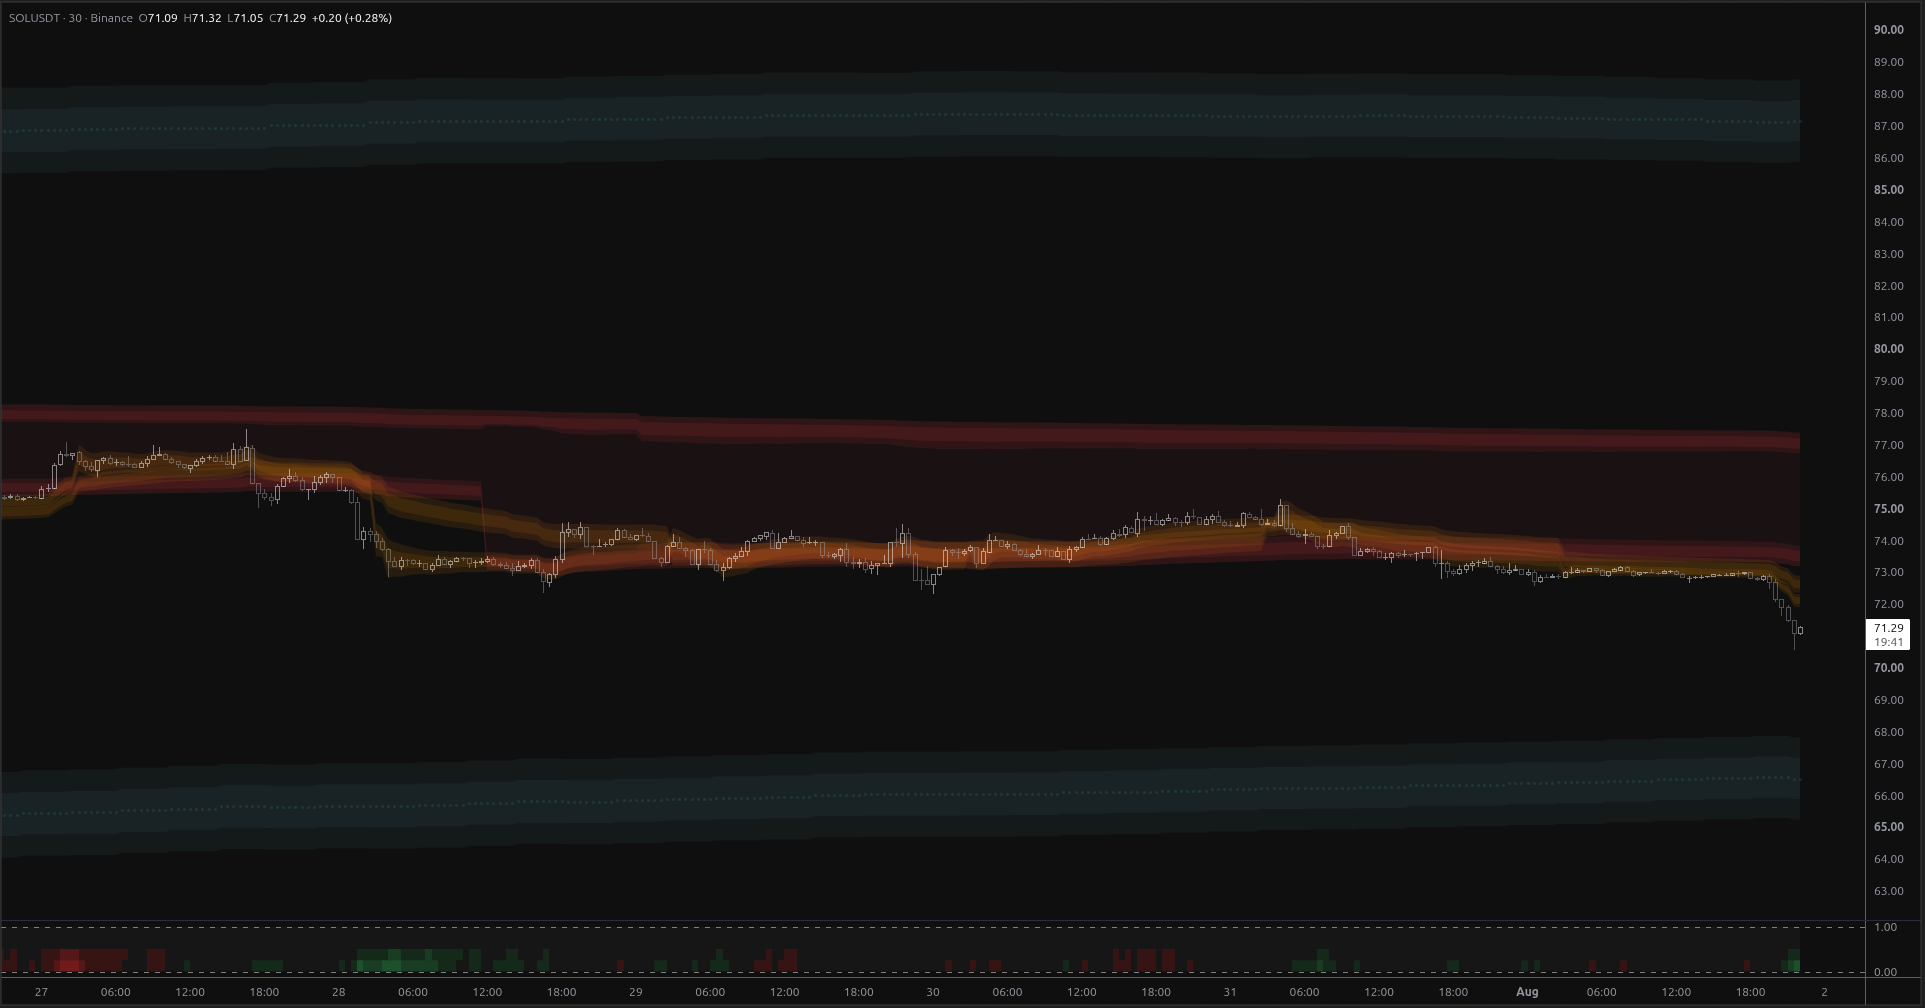
SOLUSDT has broken a multi-day coil to the downside on 5x volume, falling out of every anchored envelope. With no structural support until the below_1 band at $67.97, the path of least resistance is lower.
The content on this page is for educational and informational purposes only and does not constitute financial advice. We are not licensed financial advisors or professional traders. Trading involves substantial risk of loss and is not suitable for every investor. Past performance is not indicative of future results. Always do your own research and consult a qualified financial professional before making any investment decisions.
Executive Summary
SOLUSDT has just resolved one of the tightest multi-day compressions of the recent cycle — and it resolved lower. After grinding sideways in a shrinking range for well over a hundred half-hour bars, price has dropped in five consecutive wide-bodied bearish candles from the mid-72s to $71.09, printing a session low at $70.58 on volume running more than five times the recent average. This is not a drift; it is an expansion move with participation behind it.
The structural picture is unusually clean. Price now sits in open air: far above the nearest structural band beneath it (below_1, spanning $65.43–$67.97) and far below the next band up (above_1, $85.72–$88.26). At the same time, price has fallen out of the bottom of both anchored VWAP envelopes — the pivot-anchored one and the slower week-anchored one — and has stayed beneath them for dozens of bars. When a market is outside every fair-value envelope tracked and simultaneously in unoccupied space on the structural grid, the path of least resistance is a migration toward the next band, and that band is below.
Trend Overview: From Resistance Cap to Downside Expansion
The sequence over the visible history is textbook and worth walking through, because it explains why this break carries weight:
- Phase 1 — Cap. Price spent an extended stretch pressing the $74.40–$75.29 area, repeatedly closing near the top of its envelope and repeatedly failing to hold gains. The structural read through that stretch was a resistance cap: at the top of a band, near resistance, unable to convert.
- Phase 2 — Exhaustion and rollover. The highs stopped extending. Swing highs stepped down ($73.82 → $73.21) while swing lows barely improved ($72.56 → $72.67) — a contracting, lower-high/higher-low coil. Momentum flattened; the market went quiet.
- Phase 3 — Distribution. For roughly thirty bars price compressed into the $72.7–$73.2 shelf with a bearish tilt to the pressure readings. Volume dried up. Range width collapsed. This is the most informative part of the chart: compression in the lower half of the prior range, not the upper half.
- Phase 4 — Break (now). The coil released downward. Four straight elevated-volume bars, each closing bearish, each closing lower: 72.17 → 71.93 → 71.52 → 71.09. The structural state has flipped from distribution to breakout — meaning trending in open space — and the regime has flipped from mild bullish to mild bearish with conviction.
Critically, the regime label had been flip-flopping between neutral, mild bullish and strong bullish for days while price went nowhere — the signature of chop, where classification carries little information. The flip to mild bearish arriving simultaneously with the volume expansion and the envelope breakdown is a very different kind of signal: three independent readings agreeing at the same bar.
Level Structure: The MSL Grid and the Vacuum Beneath
The structural grid is the backbone of the longer-term outlook here. Price has been associated with the below_1 band for 254 bars, and the last band change was downward — meaning the market has spent this entire stretch hovering well above the top edge of that band without ever migrating up to the next one. That is a long structural stalemate, and stalemates of that length tend to resolve with a real move rather than another rotation.
| Band | Range | Distance from spot | Role |
|---|---|---|---|
| above_1 | $85.72 – $88.26 (mid $86.99) | ~20.6% above | Upside structural objective — currently out of reach |
| Open space | $67.97 – $85.72 | price here ($71.09) | No structural support until below_1's top edge |
| below_1 | $65.43 – $67.97 (mid $66.70) | ~18.7% below (to mid) | Primary downside magnet |
| below_2 | $55.28 – $57.82 (mid $56.55) | far below | Deeper structural floor if below_1 fails |
The practical implication: there is no structural level between $71.09 and $67.97. The grid offers nothing to lean on in that stretch. Whatever support forms there has to be built by participants in real time — prior swing lows, the $70.58 break low, and psychological levels — rather than being handed over by structure. Markets moving through vacant grid space typically travel faster than markets moving inside a band, which is exactly what the last five candles look like.
Note also that the recent level tests all show price probing the upper edge of below_1 at $67.97 from above without rejection being registered — the market has simply floated above it. A first genuine touch of $67.97 from above would be the first real structural test in a very long time.
Anchored VWAP: Outside Every Envelope
Both anchored channels tell the same story from different time horizons, which is what makes it persuasive:
- Week-anchored envelope: price is below the bottom band and has been for dozens of consecutive bars. The nearest rail overhead sits at $73.19, roughly 3.0% above spot; the band's fair-value line is $73.53 and its upper rail $73.86.
- Pivot-anchored envelope: identical verdict — below the bottom band, with the near rail at $73.21, fair value at $73.53, upper rail at $73.85.
The two envelopes agreeing to within pennies creates an unusually well-defined overhead shelf at $73.19–$73.86. That shelf is now the line that separates "bear continuation with a pullback" from "failed breakdown." Above it, the pivot envelope's upper band ($76.76–$77.40) and the week envelope's top rail ($74.71) mark where the market would have to reach to genuinely rebuild the old range.
Being outside a band means stretched relative to every anchor tracked — which cuts both ways. It is confirmation of trend, and it is also the condition under which snap-back rallies occur. Stretched does not mean finished, but it does mean the next few bars are more likely to be choppy than clean.
Momentum and Volume Context
The rejection/pressure gauge is reading oversold with falling signal and low intensity. This is precisely the reading that should not be treated as a buy trigger: oversold prints inside an active downside expansion are continuation artifacts, not reversal evidence. The gauge earns respect when it turns oversold on a retracement within an uptrend — not here.
Volume is the standout. Four consecutive spikes (2.5x, 4.0x, 2.3x, 5.2x average), every one closing bearish. Heavy volume on directional bars into a fresh breakdown is supply being distributed, not absorbed. Absorption would show as heavy volume with closes recovering toward the highs; the final bar closed at 71.09 against a 70.58 low — a partial recovery, but the body remains firmly bearish.
Scenarios, Most to Least Likely
1. Bear continuation after a pause or bear-flag retest (most likely)
The base case is that this break is real and the market works toward the below_1 band over the coming sessions. The typical mechanics: one to several bars of stabilization or a corrective bounce toward the $73.19–$73.86 envelope shelf, that shelf caps, and the decline resumes. Structural objectives in order: the below_1 upper edge at $67.97, then the below_1 midline at $66.70, with the band's lower edge at $65.43 as the extended target if momentum persists. Invalidation: a sustained close back above $73.86.
2. Range rebuild between $70.58 and $73.19 (second most likely)
Breaks out of very long coils sometimes overshoot and then stall, converting the break into a lower shelf rather than a trend. In this path, price bases between the $70.58 break low and the envelope rails near $73.19, volume normalizes, and the structural state drifts back toward compression. This is a stalemate outcome, not a bullish one — the grid still leaves below_1 as the untested target and the regime remains bearish-leaning until it flips. Watch for shrinking bar ranges and volume falling back to average as the tell.
3. Fast flush directly into below_1 (third)
Given the total absence of structural levels between spot and $67.97, a continued liquidation without a meaningful bounce is entirely possible. The signature would be further volume expansion with closes pinned near bar lows and no reclaim of $71.50–$72.00. This is the same destination as scenario 1, simply reached without the courtesy of a retest.
4. Failed breakdown and full reclaim (least likely)
For the bearish case to be genuinely wrong, price needs to climb back inside both envelopes and hold there — that means recovering $73.19, then closing above $73.86, and ultimately reclaiming the $74.71 upper rail and the $75.29 prior swing high. Only then does the old range re-establish and the very distant above_1 band ($85.72–$88.26) become a legitimate longer-horizon discussion. Given the distribution-then-break sequence and the volume signature, this is the low-probability branch — but it is the cleanest possible invalidation, and it is worth defining precisely rather than arguing about.
Key Levels Cheat Sheet
| Type | Level | Why it matters |
|---|---|---|
| Resistance | $73.19 / $73.21 | Near rails of both anchored envelopes — first reclaim test |
| Resistance | $73.53 | Anchored fair value of the lower bands |
| Resistance | $73.86 | Upper rail of both lower bands — bearish invalidation shelf |
| Resistance | $74.03 – $74.38 | Week envelope upper band structure |
| Resistance | $74.71 / $75.29 | Top rail and prior swing high — full range reclaim |
| Resistance | $76.76 – $77.40 | Pivot envelope top band |
| Support | $70.58 | Break low — first line of defence |
| Support | $67.97 | below_1 upper edge — first structural support |
| Support | $66.70 | below_1 midline — primary downside magnet |
| Support | $65.43 | below_1 lower edge — extended target |
| Support | $57.82 – $55.28 | below_2 band — deeper structural floor |
Regime Context and How to Read the Next Few Bars
The regime classifier has moved decisively to mild bearish after an extended period of indecisive flipping, and it did so on the same bars that produced the volume expansion. The structural classifier reads breakout — trending in open space — which in combination with a bearish regime and a position beneath every envelope should be read directionally as downside trend expansion, not as an upside breakout. The guidance that follows is straightforward: this is not an environment for initiating fresh longs, and mean-reversion attempts against the break should be treated as low-quality until the $73.19–$73.86 shelf is reclaimed.
The three things that would change the read, in order of importance: (1) a close back above $73.86 with volume, which would neutralize the breakdown; (2) volume collapsing back to average while price holds above $70.58, which converts the move into a range and argues for patience; (3) a first meaningful rejection at the below_1 upper edge of $67.97, which would mark the point where the structural grid finally starts to do work rather than simply being distant scenery.
This note is market analysis for educational purposes and describes structure, probabilities and invalidation conditions — not a trade recommendation.
Featured Indicators
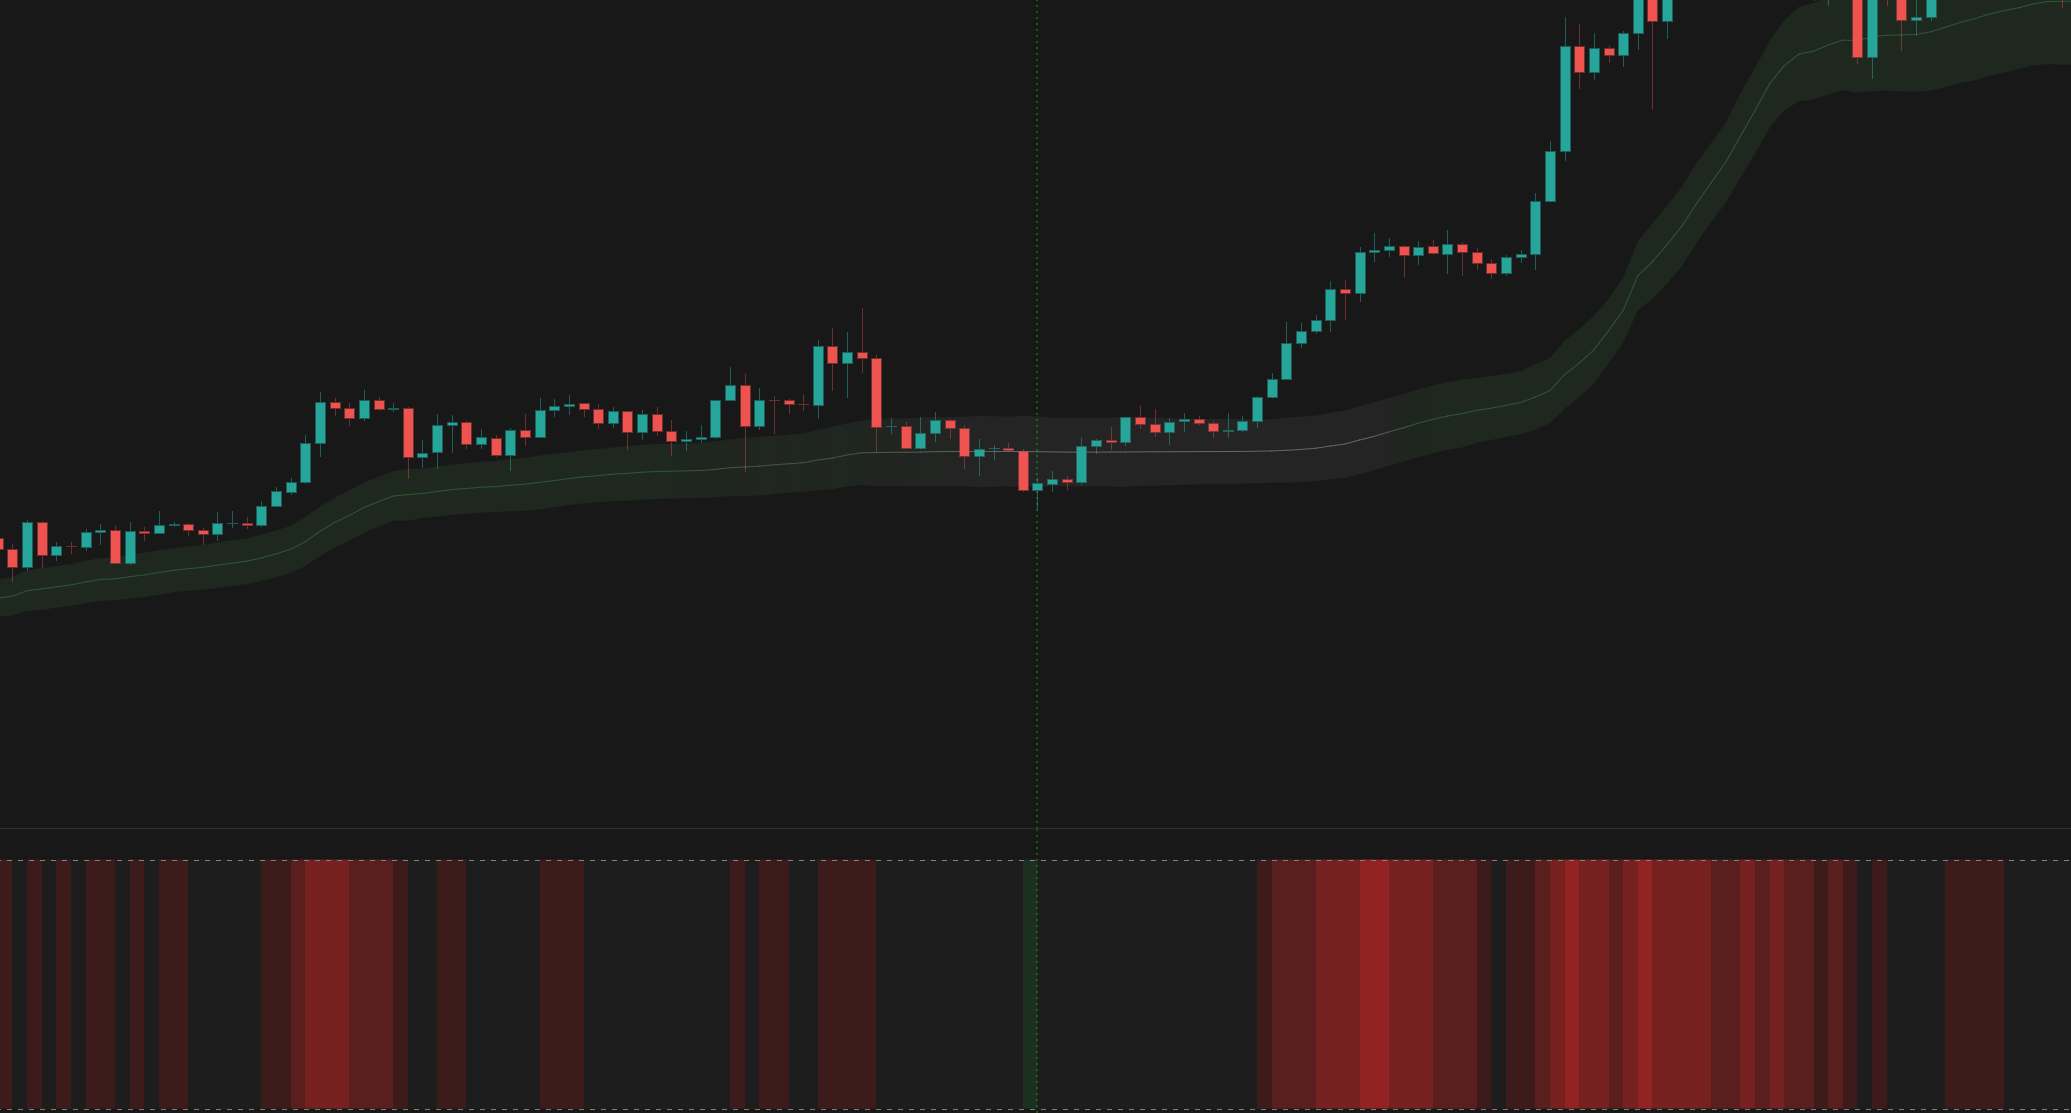
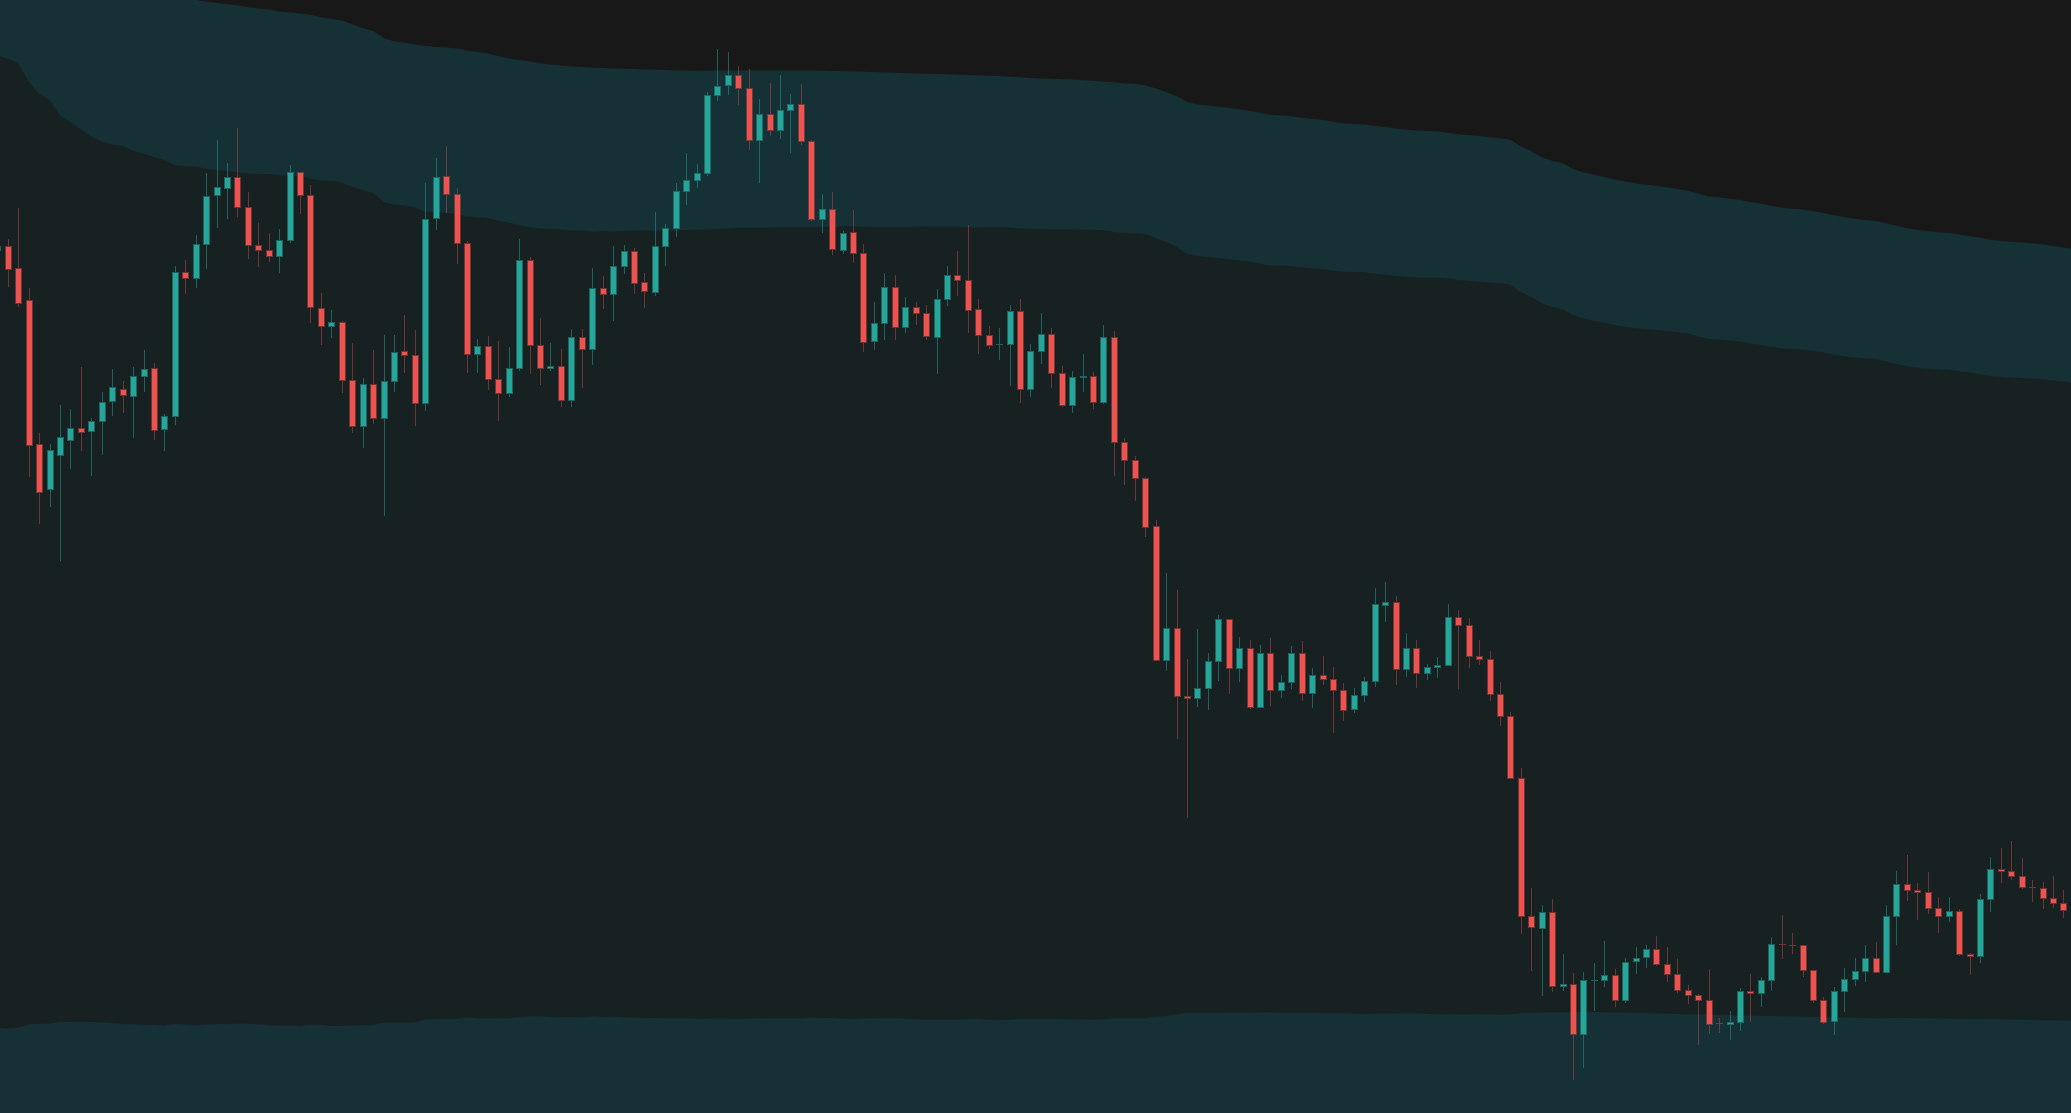
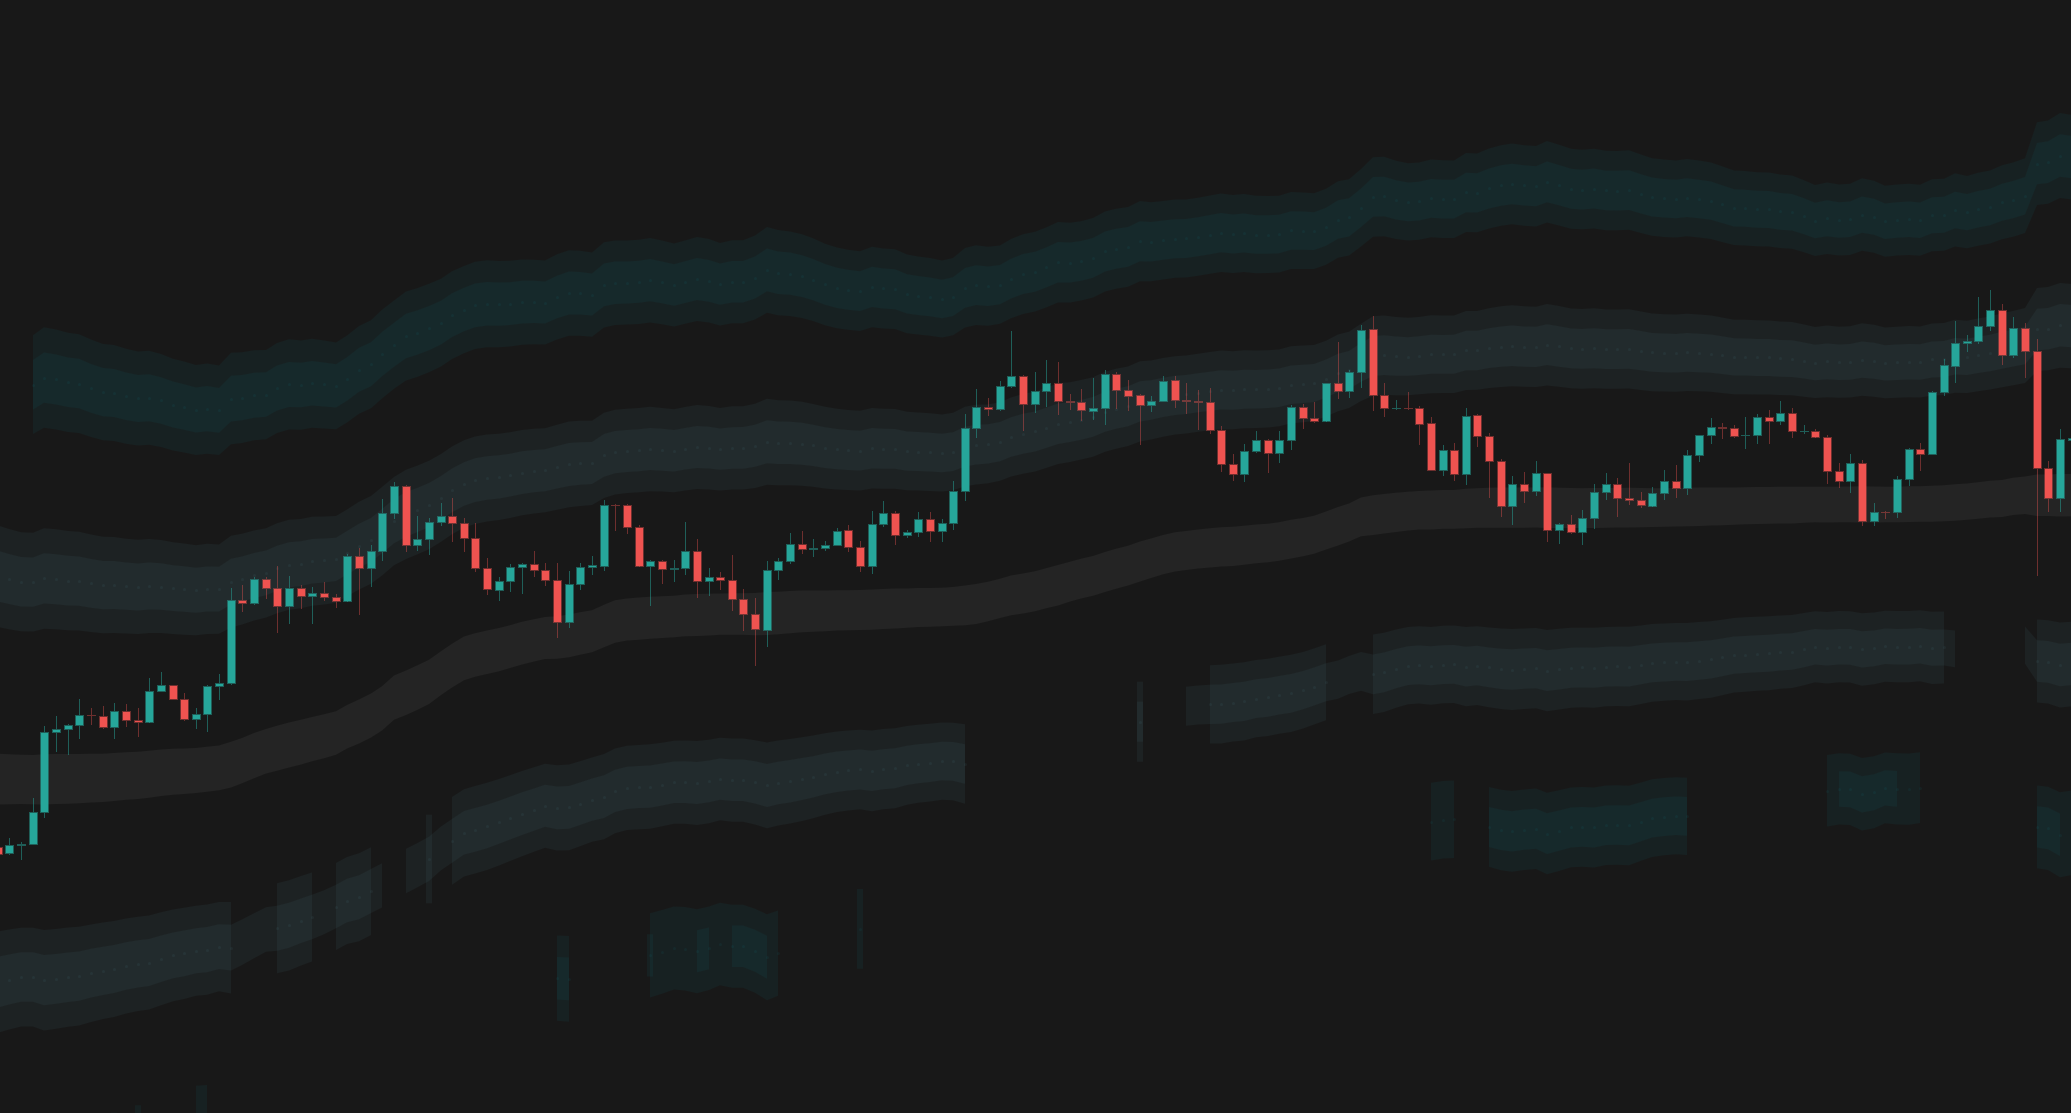
The indicators referenced in this trading idea.
Related Ideas
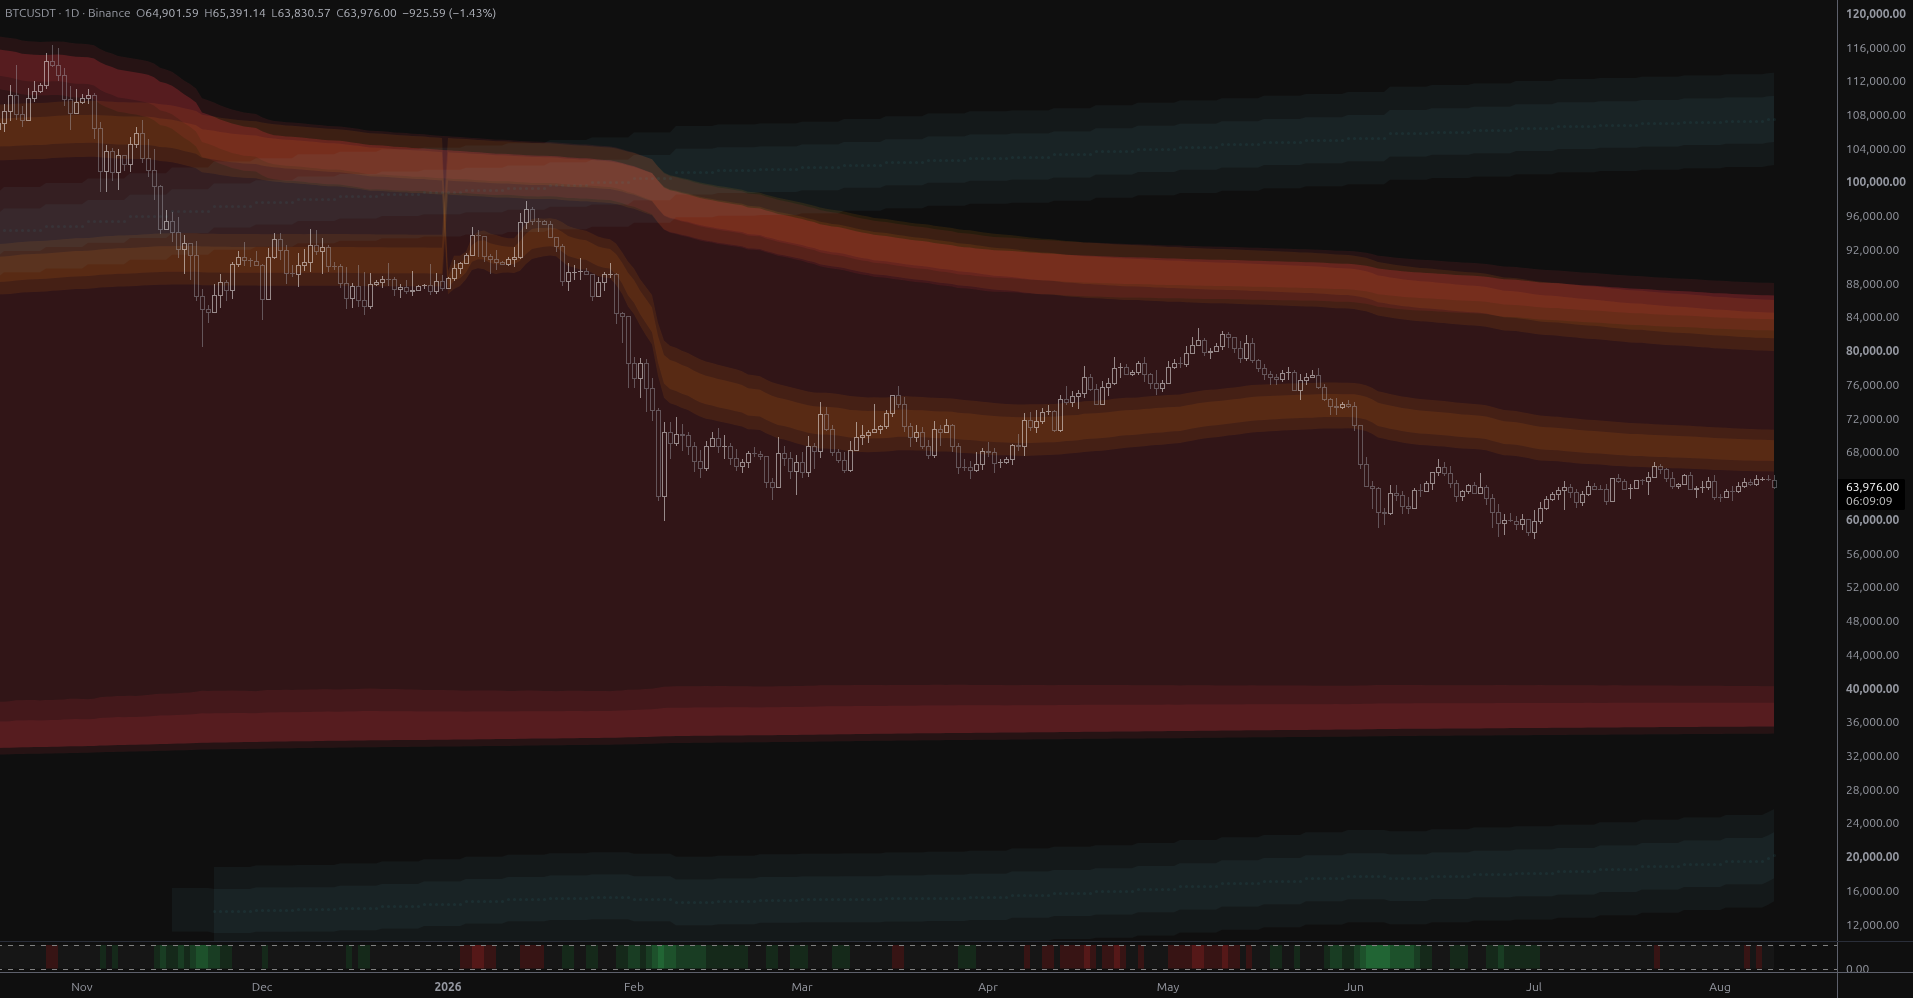
BTC Coils Just Under Its Yearly Value Rail
Bitcoin is coiling at $64,901 just 1.8% below its year-anchored value rail at $66,048, with structural bands far away in both directions. Ranked scenarios, key levels and the air pocket below $57,800.
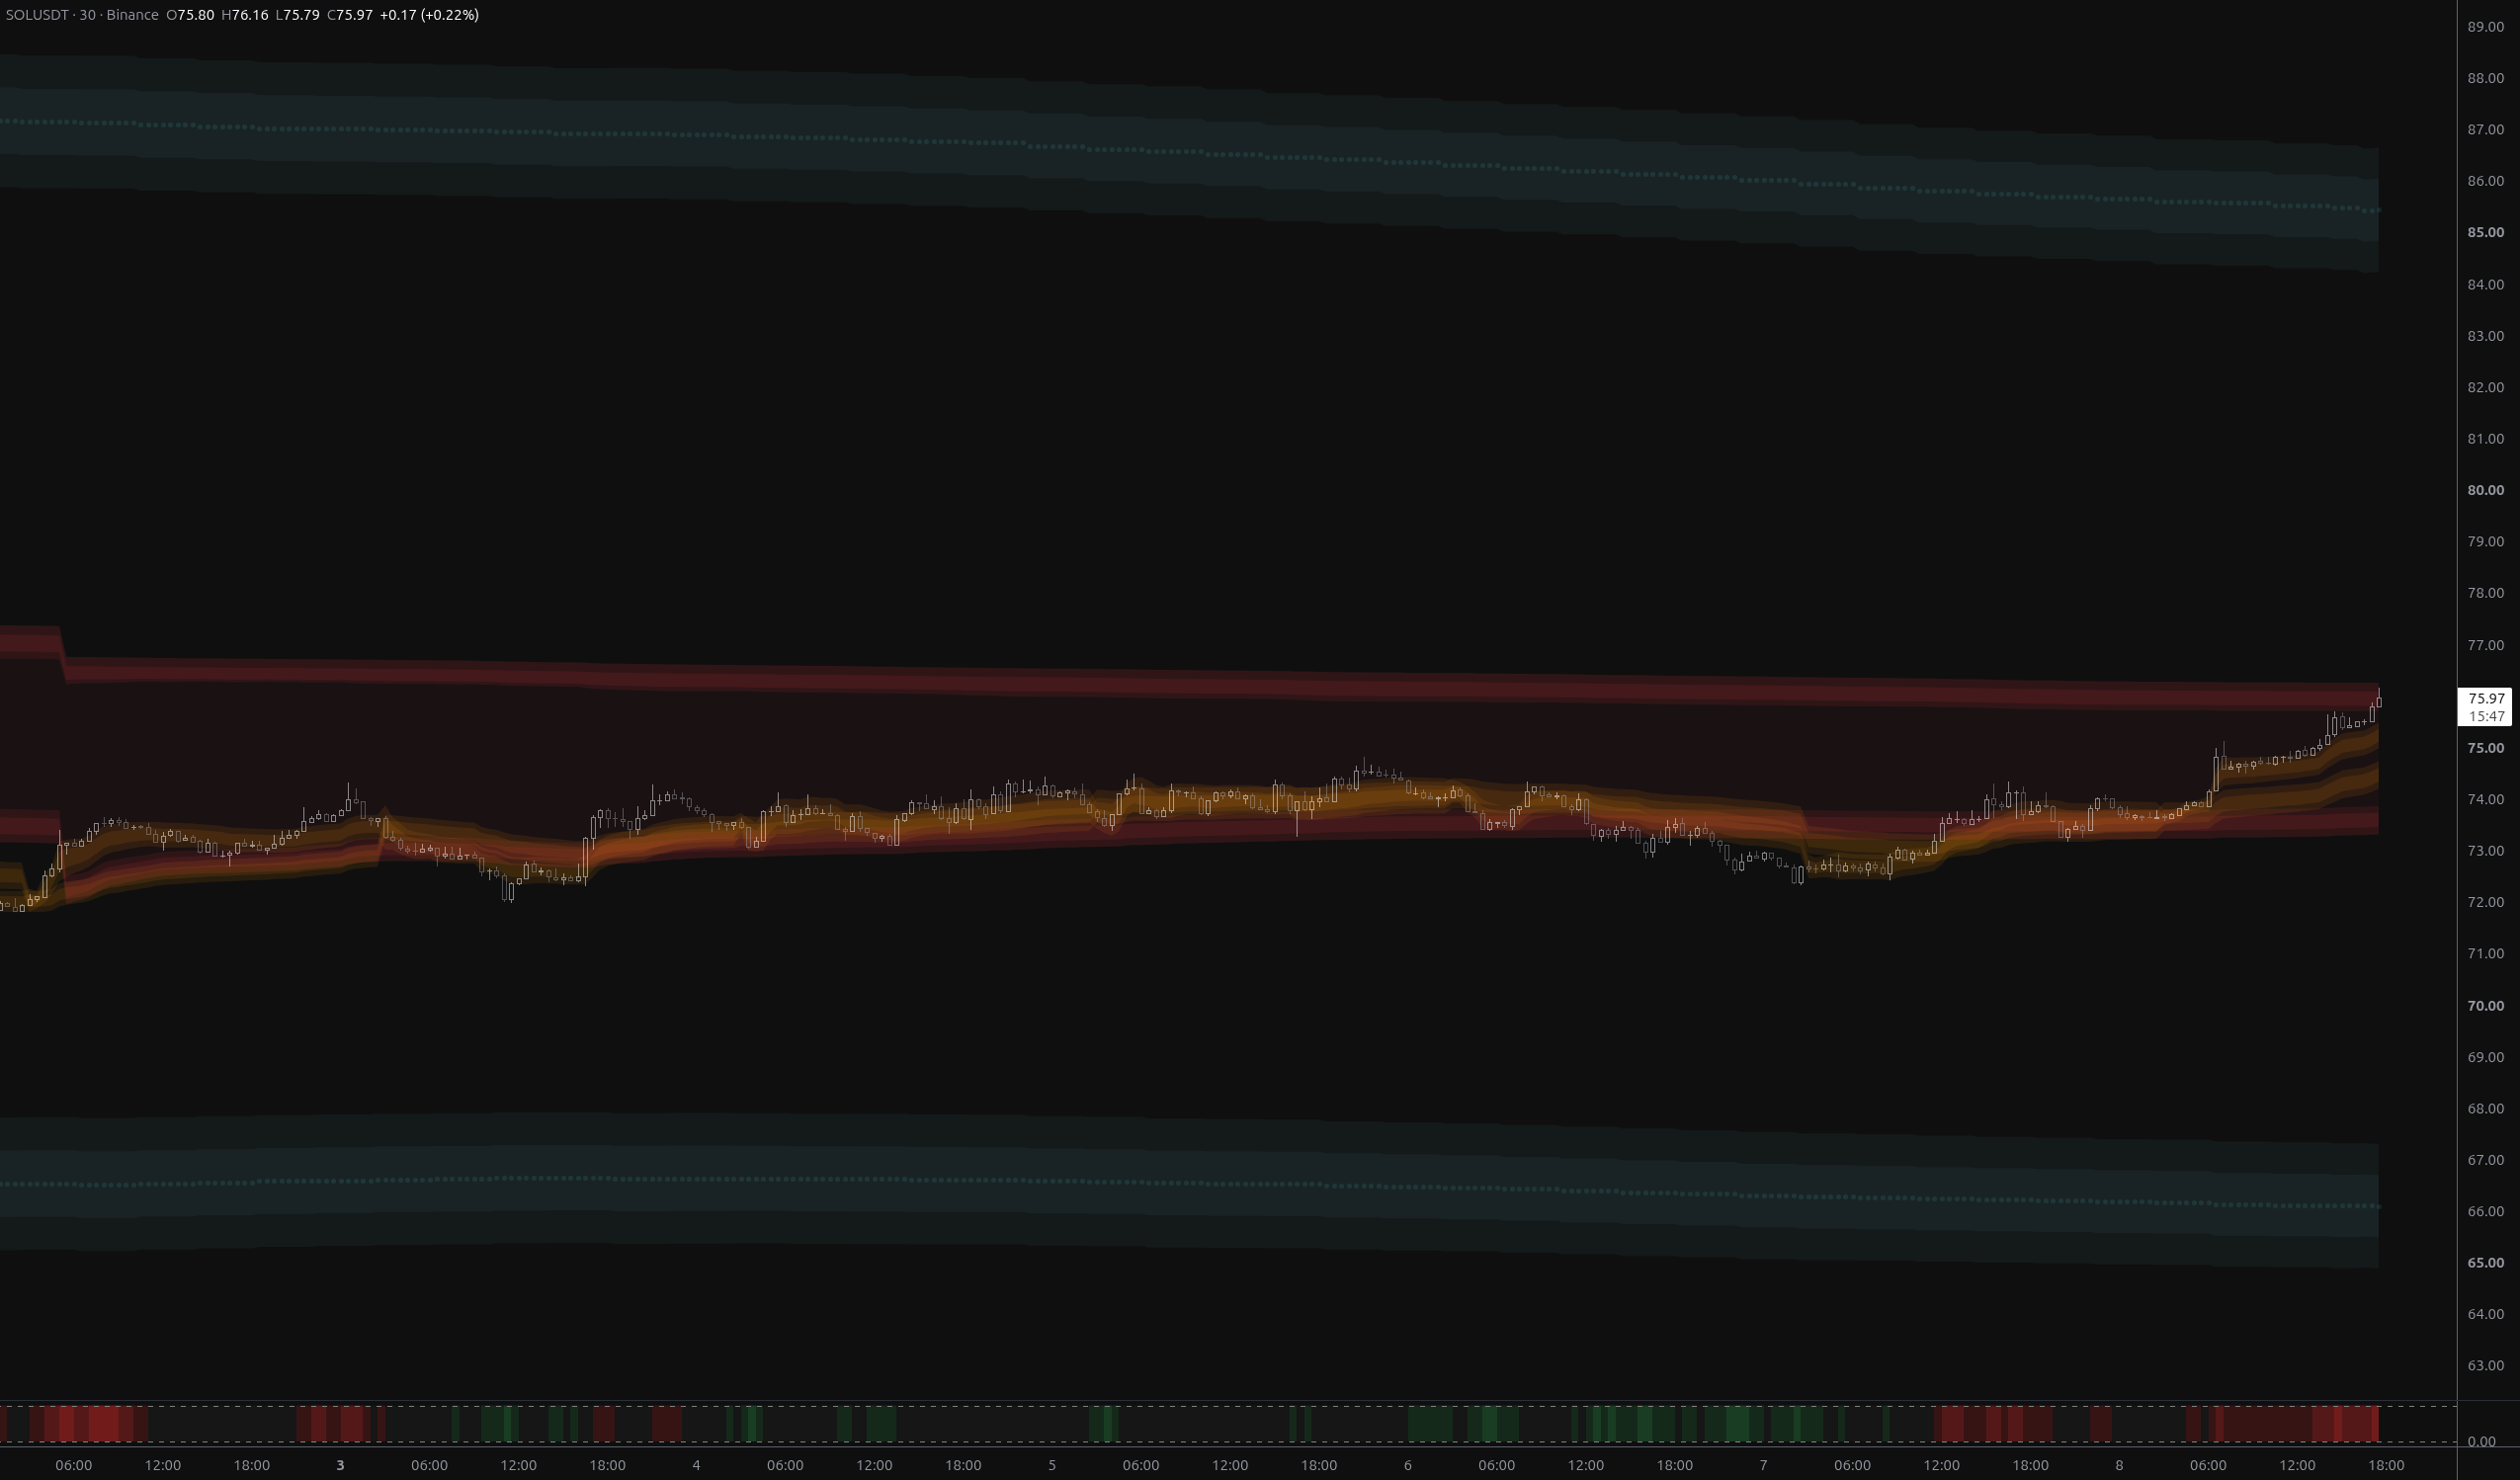
SOLUSDT: Bears Invalidated, $76.27 Now the Test
SOLUSDT has fully reversed the breakdown, reclaiming both fair-value envelopes and flipping its nearest structural band to above_1. The $75.73–$76.27 rail zone is now the decisive test.
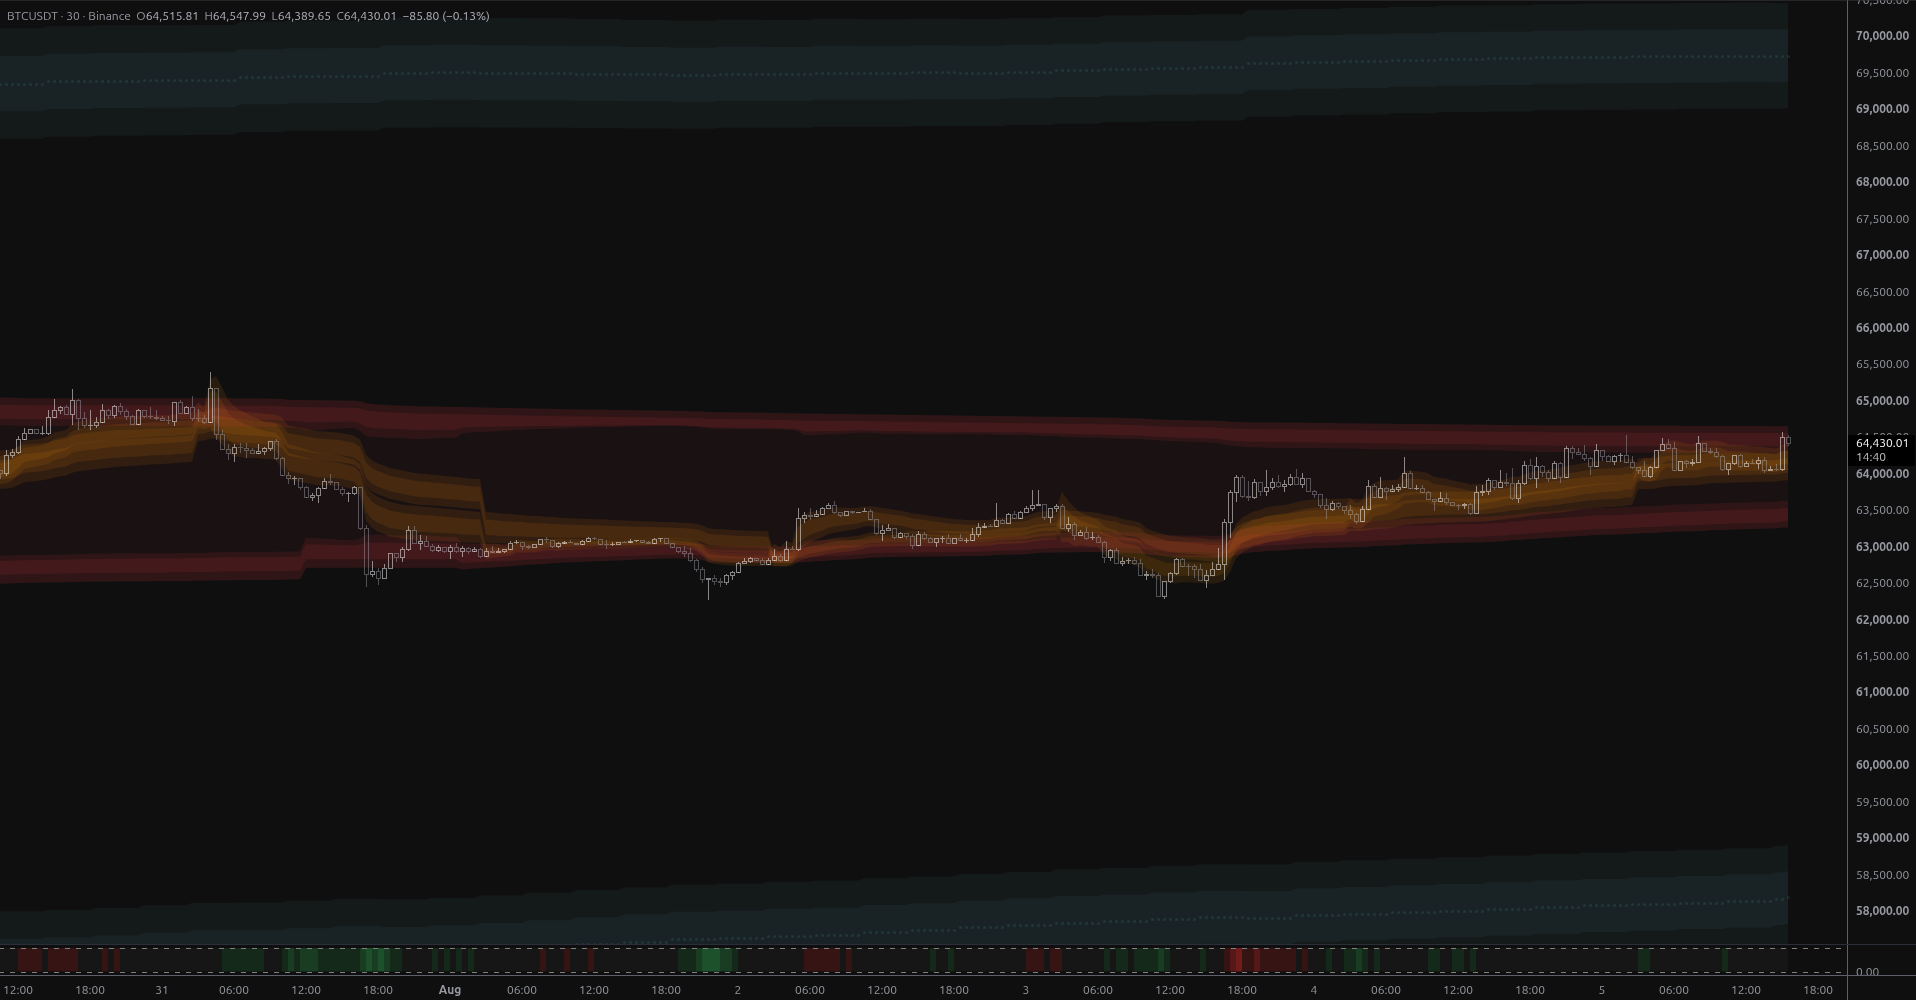
BTCUSDT: Breakout Into Open Structural Air
BTCUSDT broke above week-scale anchored value on 2.7x volume, leaving it stranded in structural open air with the nearest MSL band 6.8% overhead at $68,925 and no support until $59,012.
Connect With Us
Join our community of traders and stay updated with our latest tools and market insights.