
BTC at $74.7K: Distribution Phase Tests Key Band
BTC trapped in above_2 band for 96 bars amid distribution. Sharp recovery to $74.7K faces heavy resistance at $75K.
The content on this page is for educational and informational purposes only and does not constitute financial advice. We are not licensed financial advisors or professional traders. Trading involves substantial risk of loss and is not suitable for every investor. Past performance is not indicative of future results. Always do your own research and consult a qualified financial professional before making any investment decisions.
Market Overview: A Bearish Regime Meets a Sharp Intraband Recovery
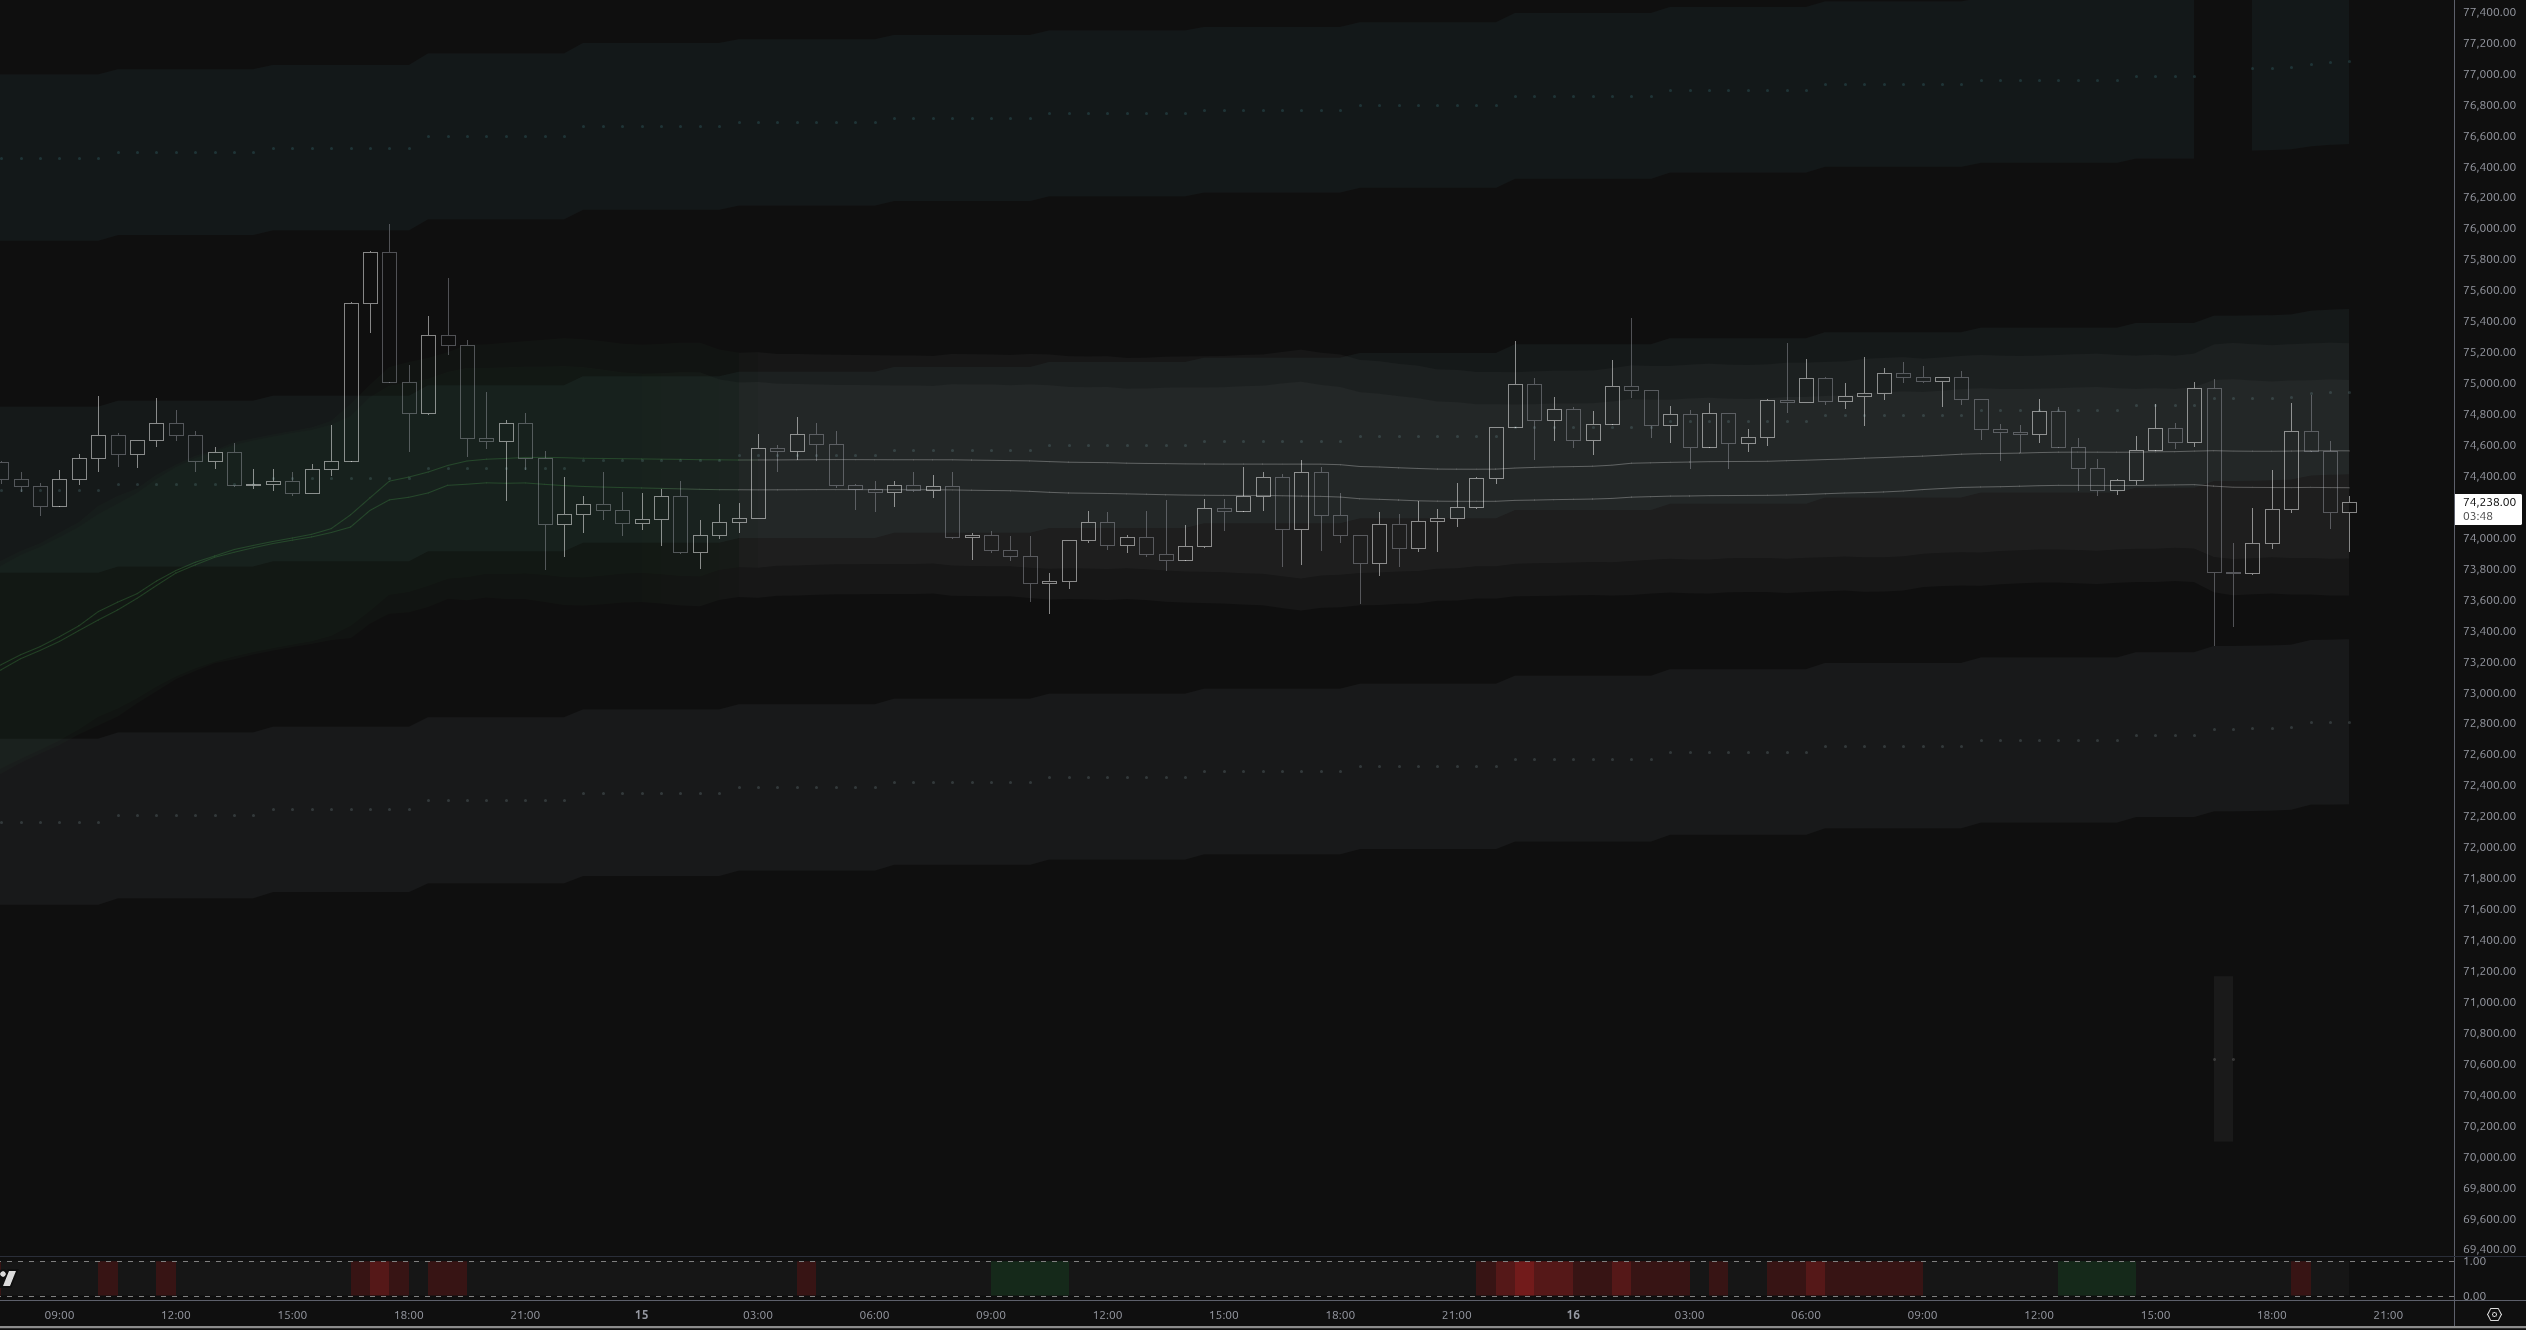
Bitcoin is trading at $74,727 on the 30-minute timeframe, currently situated within the MSL above_2 band ($74,108 – $75,098, midpoint $74,603). The asset has been confined to this band for an extraordinary 96 consecutive bars — roughly 48 hours — following a downward band change from above_3. This prolonged residency within a single MSL band, combined with a high-confidence bearish regime (1.00) and distribution structural state (0.99), paints a complex picture that demands careful analysis.
The most recent candle is a large bullish bar with elevated volume (2.44x average), surging from $74,189 to $74,727. This follows a dramatic sequence: a massive bearish candle 4 bars ago ($75,030 → $73,788 on 3.99x volume) that briefly pierced the band low, followed by a doji with a long lower wick at $73,427, and now a strong recovery. The question is whether this represents genuine demand or merely a dead-cat bounce within a deteriorating structure.
MSL Band Structure: 96 Bars of Contained Price Action
Current Band Context
| Level | Price | Distance |
|---|---|---|
| Band Above (above_3) High | $76,582 | +2.48% |
| Band Above (above_3) Mid | $76,582 | +2.48% |
| Current Band (above_2) High | $75,098 | +0.50% |
| Current Band (above_2) Mid | $74,603 | -0.17% |
| Current Band (above_2) Low | $74,108 | -0.83% |
| Band Below (above_1) Mid | $72,624 | -2.81% |
Price currently sits at 0.62 within the band — slightly above the midpoint, having recovered sharply from the lower boundary. The band width is a relatively tight 1.33% ($989 range), which means moves to band edges happen quickly.
Recent Level Tests — Critical Evidence
The recent level test history reveals a market that is struggling at both extremes of this band:
- Band high ($75,000): Tested and rejected — price reached $74,903 and was turned away. This rejection preceded the violent 4-bar-ago selloff.
- Band low ($74,108): Tested three times in rapid succession — closes at $73,788, $73,781, and $73,973 all breached below the band low. The first two were not rejected (price stayed below), but the most recent test at $74,189 was rejected, with price snapping back above.
This pattern — rejection at the top, multiple tests at the bottom with eventual rejection — is characteristic of a compression phase that typically resolves with a directional breakout. The fact that the band low was breached but price recovered suggests there is meaningful demand near $73,400–$73,800, but the repeated failures at $75,000 indicate supply is firmly in control above.
Historical Band Transitions
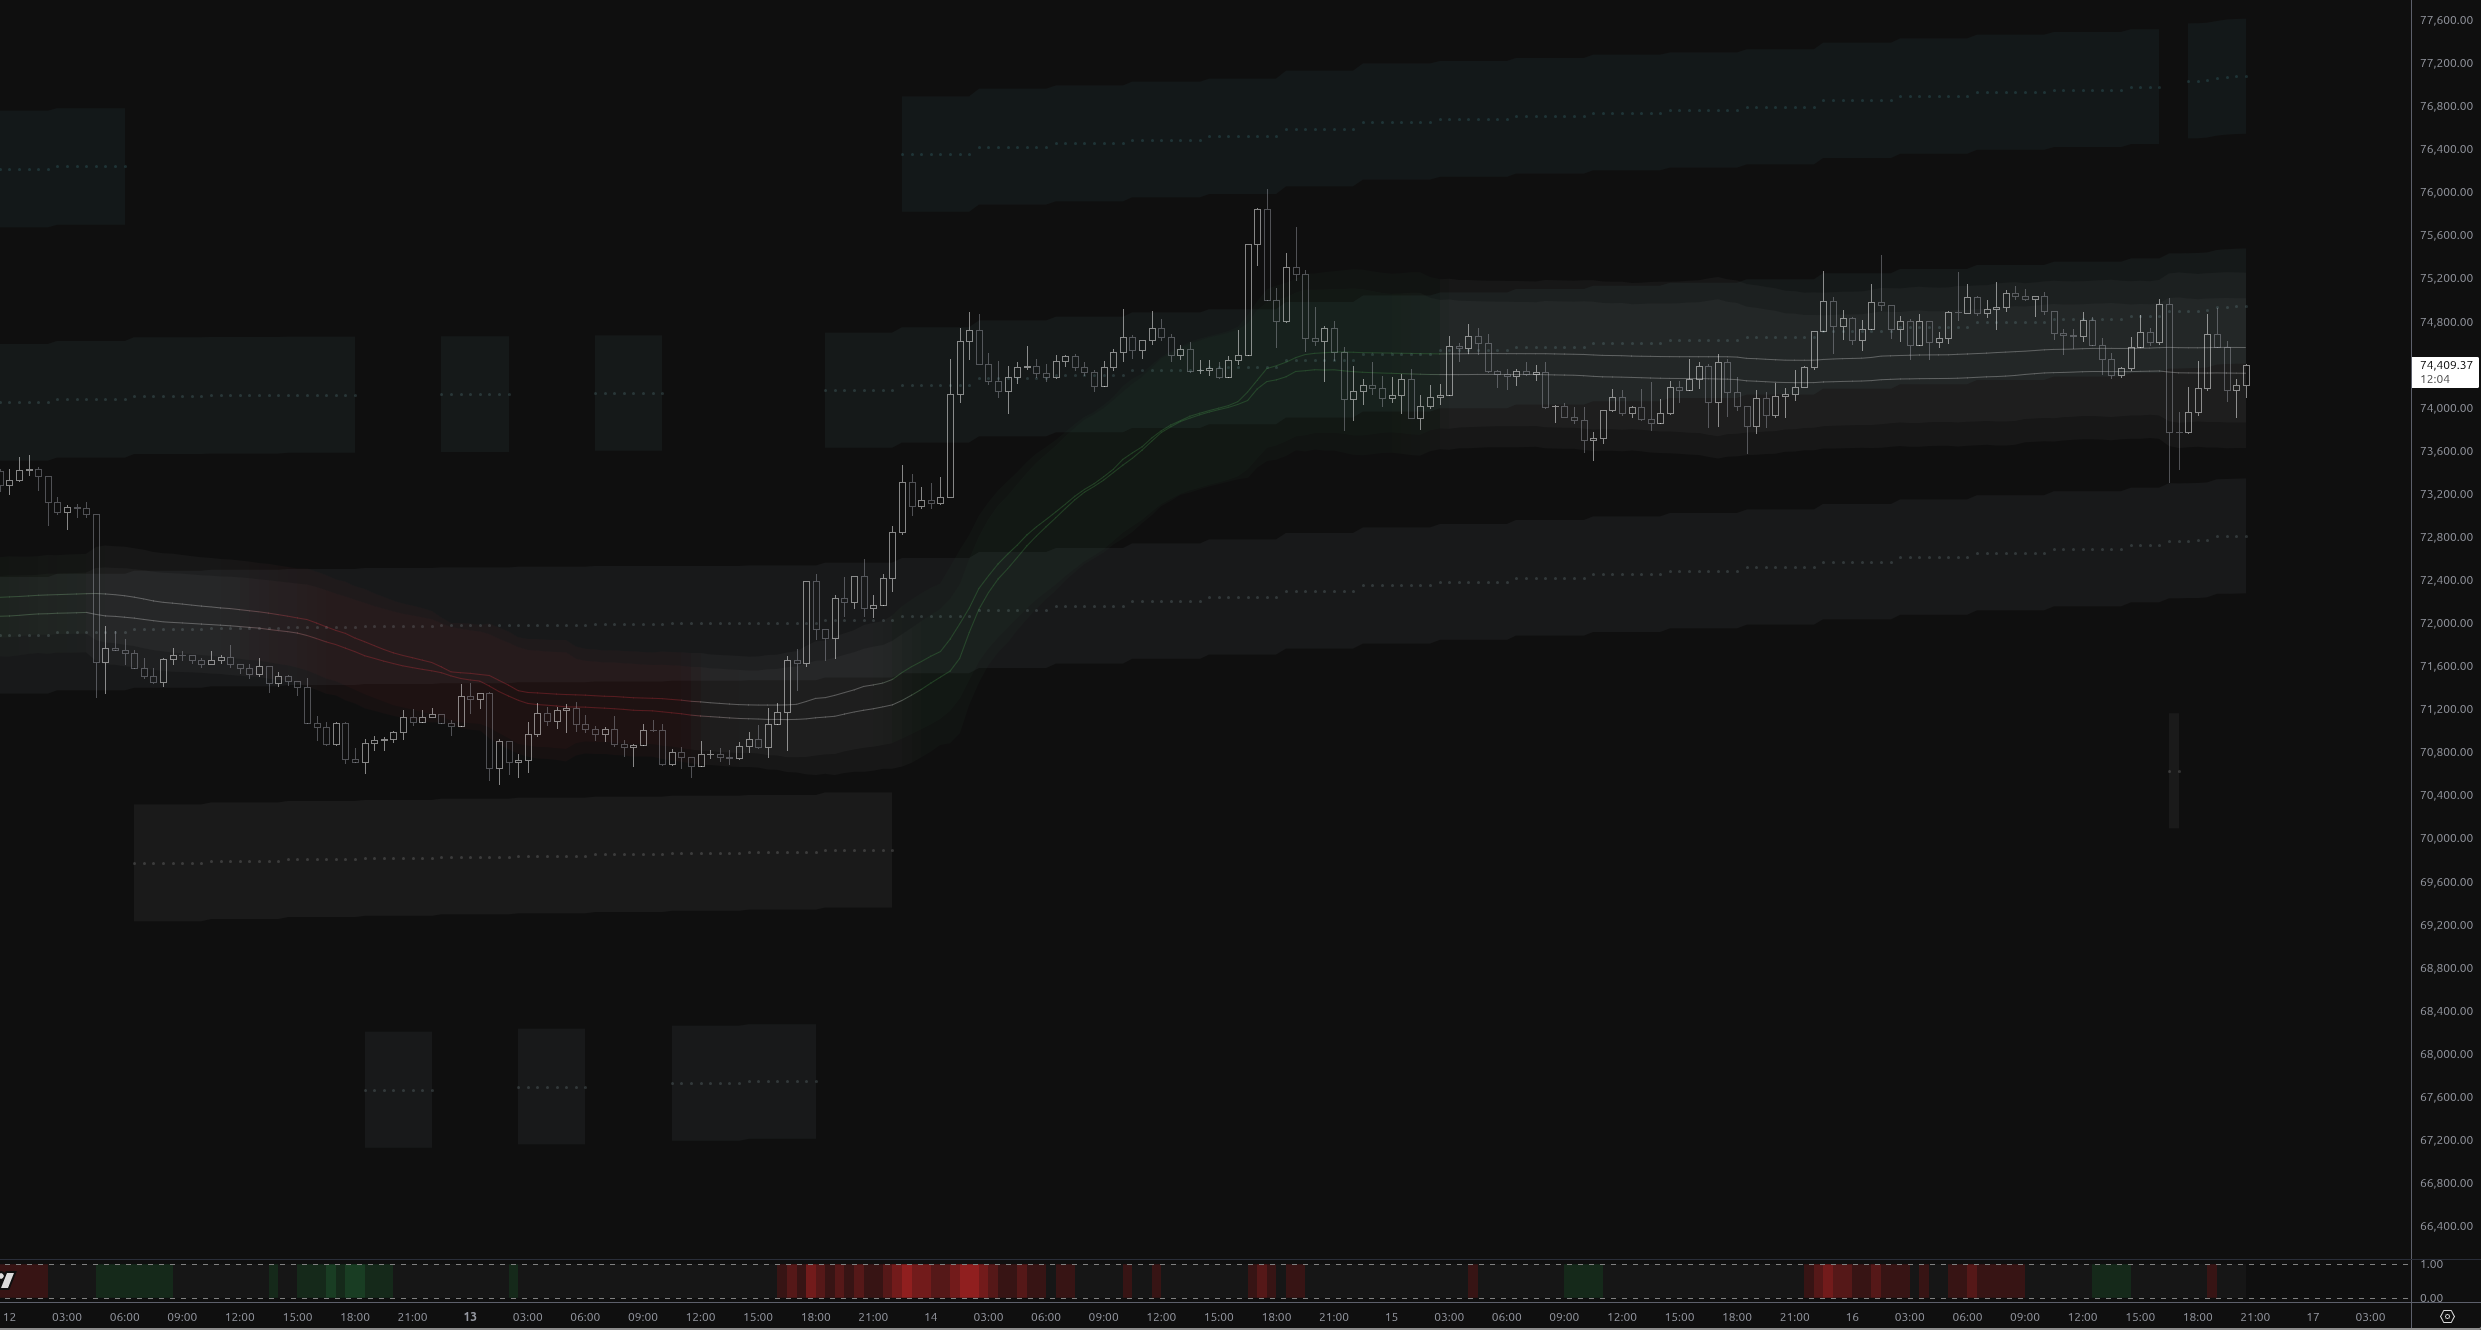
Looking at the full history, the band journey has been:
- Price in the base band (~$69,850), deeply bearish with strong downward AMAB slopes.
- Transition up to above_1 (~$71,817), with price consolidating below AMAB bands.
- Gradual accumulation in above_1, AMAB slopes flattening, regime shifting from bearish to mild bearish.
- Explosive breakout through above_2 into above_3, with AMAB slopes reaching strong bullish (6-7+). Regime shifted to strong bullish. Price peaked near $75,861.
- Retreat from above_3 back into above_2, where price has been trapped for 96 bars. AMAB slopes collapsed from strong bullish to flat. Regime deteriorated from strong bullish → mild bullish → neutral → mild bearish → bearish.
This trajectory tells a clear story: a powerful rally that has exhausted itself, with the market now in a prolonged distribution/exhaustion phase within the above_2 band.
Trend Analysis: AMAB Signals Confirm Weakness
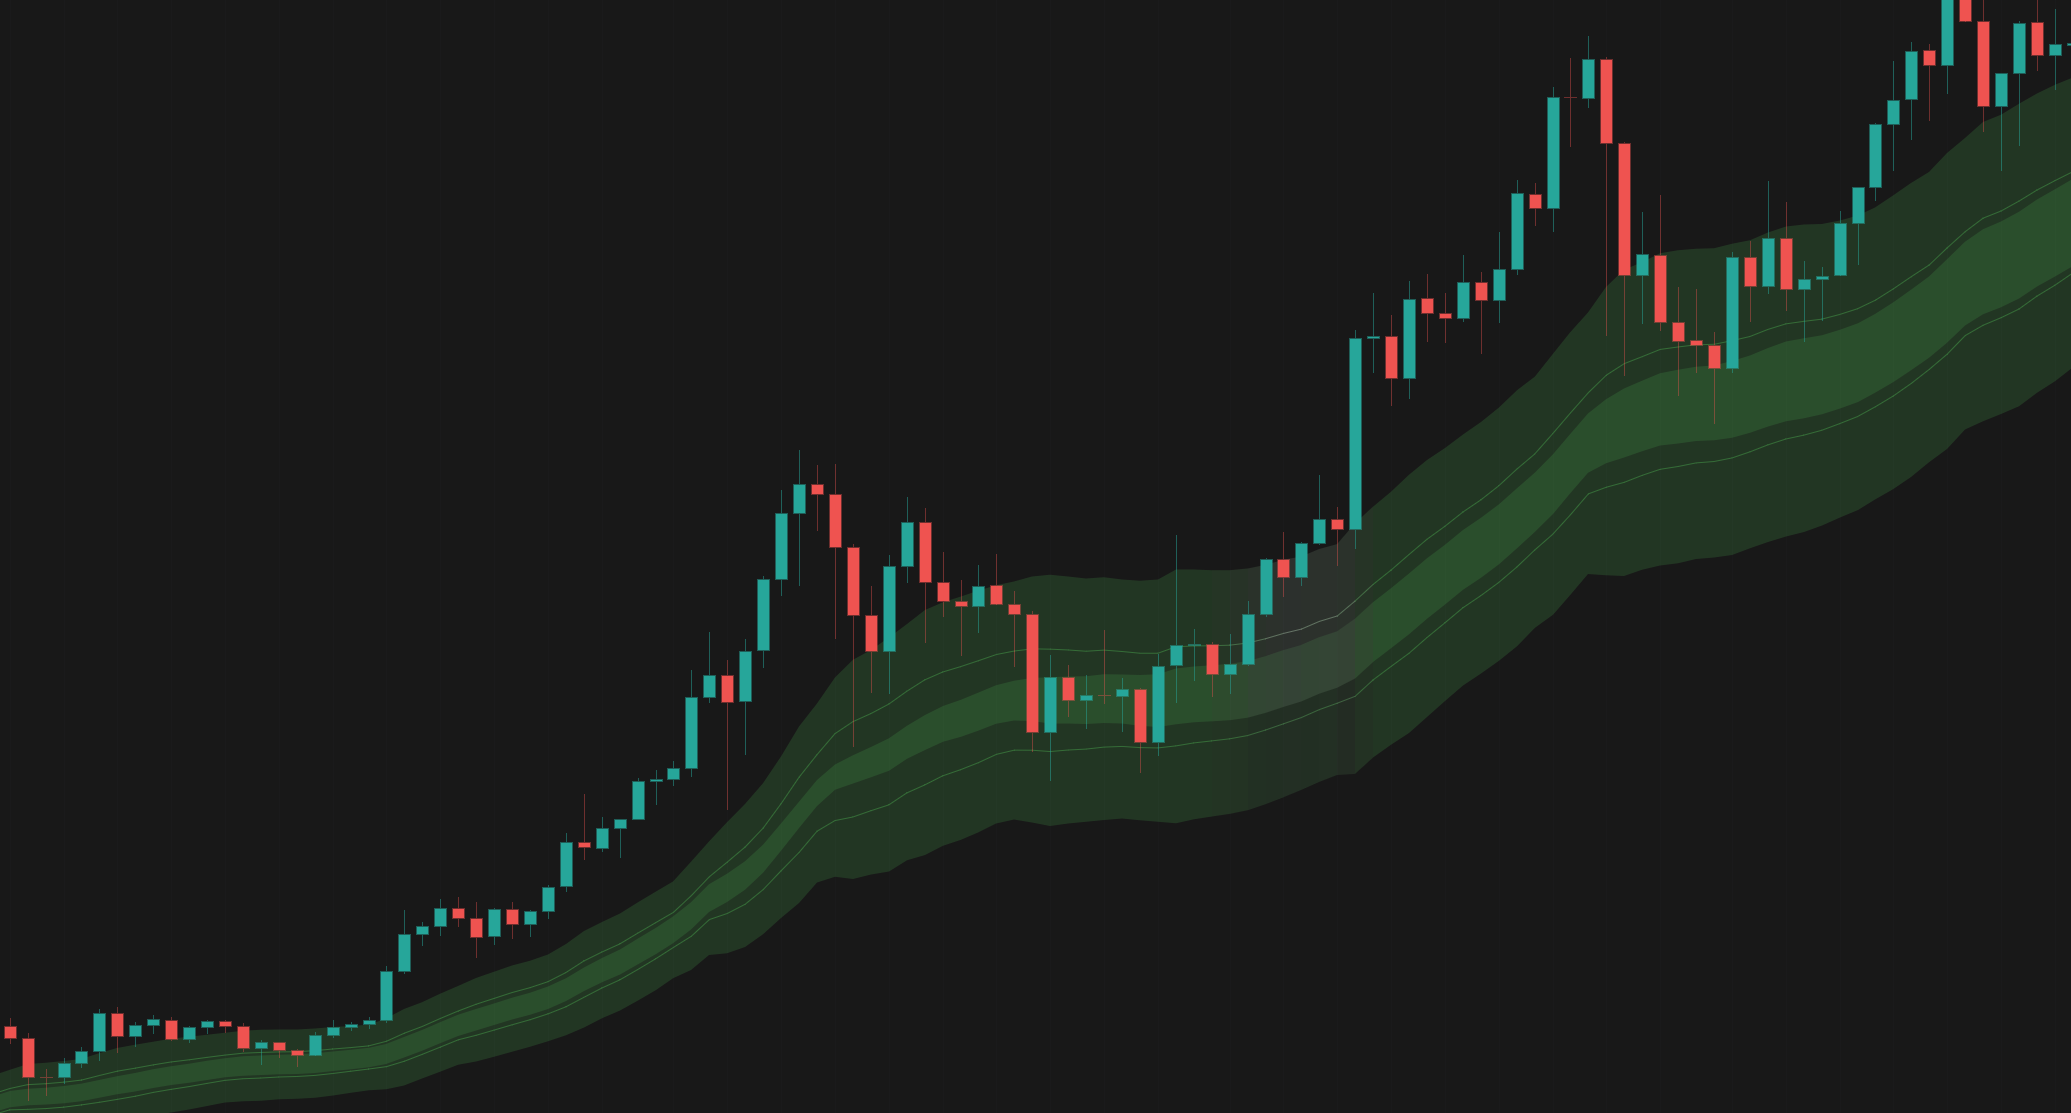
Both AMAB moving averages are flat, with MA1 showing "accelerating" strength — meaning the flatness is intensifying, not resolving. Key observations:
- Price vs MA1: Below the lower band — bearish positioning. Price has been below MA1 for the majority of recent bars (only 6 of the last 20 candles above MA1).
- Price vs MA2: On the lower band — sitting right at the edge of bearish territory. 7 of the last 20 candles have been below MA2.
- Slope change: 79 bars ago — the slopes transitioned to flat nearly 40 hours ago and have not recovered, despite the earlier strong bullish readings.
- Recent events: Price just touched both MA1 lower and MA2 lower simultaneously, and entered the MA2 band from below. This is a potential bullish signal if it holds, but in the context of a bearish regime, it's more likely a retest of resistance from below.
The AMAB picture is unambiguous: the uptrend that drove price from $70,700 to $75,800 is over. The adaptive moving averages have fully flattened, and price is now oscillating around and below them rather than riding above them.
Regime and Structural Context
Regime: Bearish (Confidence 1.00)
The regime classifier has reached maximum bearish confidence. The regime journey over the dataset has been remarkable:
- Started bearish → shifted to mild bearish → mild bullish → strong bullish (during the rally) → and has now fully reverted back through mild bullish → neutral → mild bearish → bearish.
A confidence of 1.00 means the model sees no ambiguity — all probabilistic weight is on the bearish state. This is the strongest possible bearish regime signal.
Structural State: Distribution (Confidence 0.99)
The structural classifier has shifted from exhaustion to distribution. This is a significant transition:
- Exhaustion (which dominated the last ~50+ bars) indicates overextension with declining momentum — price stretched above support but losing steam.
- Distribution indicates a compressed upper range with bearish pressure — the market is actively distributing supply, typically preceding a breakdown.
The shift from exhaustion to distribution, combined with the bearish regime, suggests the market has moved past the "losing momentum" phase into the "actively preparing to move lower" phase.
Volume Analysis: Telling Spikes
Volume patterns reinforce the bearish narrative:
- 4 bars ago: 1,530 contracts at 3.99x average — the largest volume spike in recent history — produced a bearish candle that crashed from $75,030 to $73,788. Heavy volume on the downside.
- Current bar: 937 contracts at 2.44x average — a bullish candle recovering to $74,727. Significant volume, but notably less than the bearish spike.
- 8 bars ago: 1,059 contracts at 2.76x — bullish, but this was the rally attempt that was subsequently crushed by the 4-bar-ago selloff.
The volume asymmetry — heavier selling volume than buying volume — is a classic distribution signature. Sellers are more aggressive and committed than buyers.
Swing Structure: Technically Bullish, Contextually Fragile
The swing structure shows an uptrend pattern (HH+HL):
- Last swing high: $75,425 | Previous: $74,786
- Last swing low: $73,580 | Previous: $73,514
While technically higher highs and higher lows, the structure is extremely fragile. The higher lows are barely higher ($73,580 vs $73,514 — only $66 difference), and the swing low at $73,580 was set just 3 bars ago during the violent selloff. A break below $73,514 would invalidate this uptrend structure entirely and confirm a bearish swing reversal.
Scenarios and Outlook
Scenario 1: Band Breakdown to above_1 (Most Likely)
Given the bearish regime (1.00 confidence), distribution state (0.99 confidence), volume asymmetry favoring sellers, and the repeated failures at the band high, the most probable path is a breakdown below the above_2 band low ($74,108) and a move toward the above_1 band at $72,624.
- Trigger: Price fails to reclaim $75,000 and rolls over, breaking below $74,108 with conviction.
- Target: above_1 band midpoint at $72,624 (approximately -2.8% from current price).
- Extended target: above_1 band low at $72,130 (-3.5%).
- Supporting evidence: The band low has already been breached three times in the last few bars. Each breach was deeper. The recovery from the latest breach, while sharp, occurred on less volume than the selloff. Distribution + bearish regime is the classic pre-breakdown combination.
- Invalidation: A sustained close above $75,098 (band high) with strong volume would invalidate this scenario.
Scenario 2: Continued Range Compression Within above_2 (Possible)
The 96-bar residency in this band could extend further. Price may continue oscillating between $74,100 and $75,000, with neither bulls nor bears able to force a resolution.
- Trigger: Price recovers to $74,800–$75,000 but is rejected again, then bounces off $74,100–$74,200 again.
- Characteristics: Declining volume, narrowing range, AMAB bands converging further.
- Duration: Could persist for another 20-40 bars before resolving.
- Supporting evidence: The band low has shown some demand (the rejection on the latest test). AMAB slopes are flat, not bearish — suggesting no strong directional momentum yet. PRO is neutral with a rising signal trend, indicating selling pressure is not extreme.
- Resolution: Eventually resolves in the direction of the dominant regime (bearish), making this a delay rather than a reversal of Scenario 1.
Scenario 3: Bullish Reclaim of above_3 (Least Likely)
The current bullish candle could be the start of a genuine recovery, with price breaking above $75,098 and re-entering the above_3 band ($74,125 – $76,582).
- Trigger: Price breaks above $75,098 with volume exceeding 1,000+ contracts per bar, AMAB slopes turn positive.
- Target: above_3 midpoint at $76,582 (+2.5%).
- Required conditions: Regime would need to shift from bearish — currently at 1.00 confidence, making this a very high bar. Structural state would need to shift from distribution to accumulation or breakout.
- Supporting evidence: The swing structure technically remains bullish (HH+HL). The sharp recovery from $73,427 shows some demand. The current candle is large and bullish with elevated volume.
- Why it's unlikely: Every indicator of higher-timeframe context — regime, structural state, AMAB trend, volume profile — argues against this. The rally from $70,700 to $75,800 appears to be fully exhausted. Overbought PRO signals dominated the entire rally phase, and the regime has completed a full round-trip from bearish to strong bullish and back to bearish.
Key Levels to Watch
| Level | Price | Significance |
|---|---|---|
| Swing Low (Critical Support) | $73,514–$73,580 | Break below invalidates uptrend structure |
| Band Low (above_2) | $74,108 | Key support — 3 recent breaches, last one rejected |
| Band Mid (above_2) | $74,603 | Current equilibrium — price just reclaimed this |
| Band High (above_2) | $75,098 | Key resistance — recently rejected at $74,903 |
| Previous Swing High | $75,425 | Must break for bullish continuation |
| Band Below Mid (above_1) | $72,624 | Downside target if above_2 breaks |
Conclusion
Bitcoin is in a late-stage distribution phase within the above_2 MSL band. The confluence of a maximum-confidence bearish regime, high-confidence distribution structural state, flat AMAB trends with price below both moving average bands, and volume patterns favoring sellers all point toward an eventual downside resolution. The current bullish recovery candle, while notable, is occurring within a context where every prior recovery attempt in this band has been sold into. The $75,000–$75,098 zone represents the critical resistance that bulls must overcome to change the narrative, while a break below $73,514 would confirm the bearish thesis and open the path toward the above_1 band near $72,625. Traders should be prepared for heightened volatility as this 96-bar compression phase approaches its resolution.
Featured Indicators
The indicators referenced in this trading idea.
Related Ideas
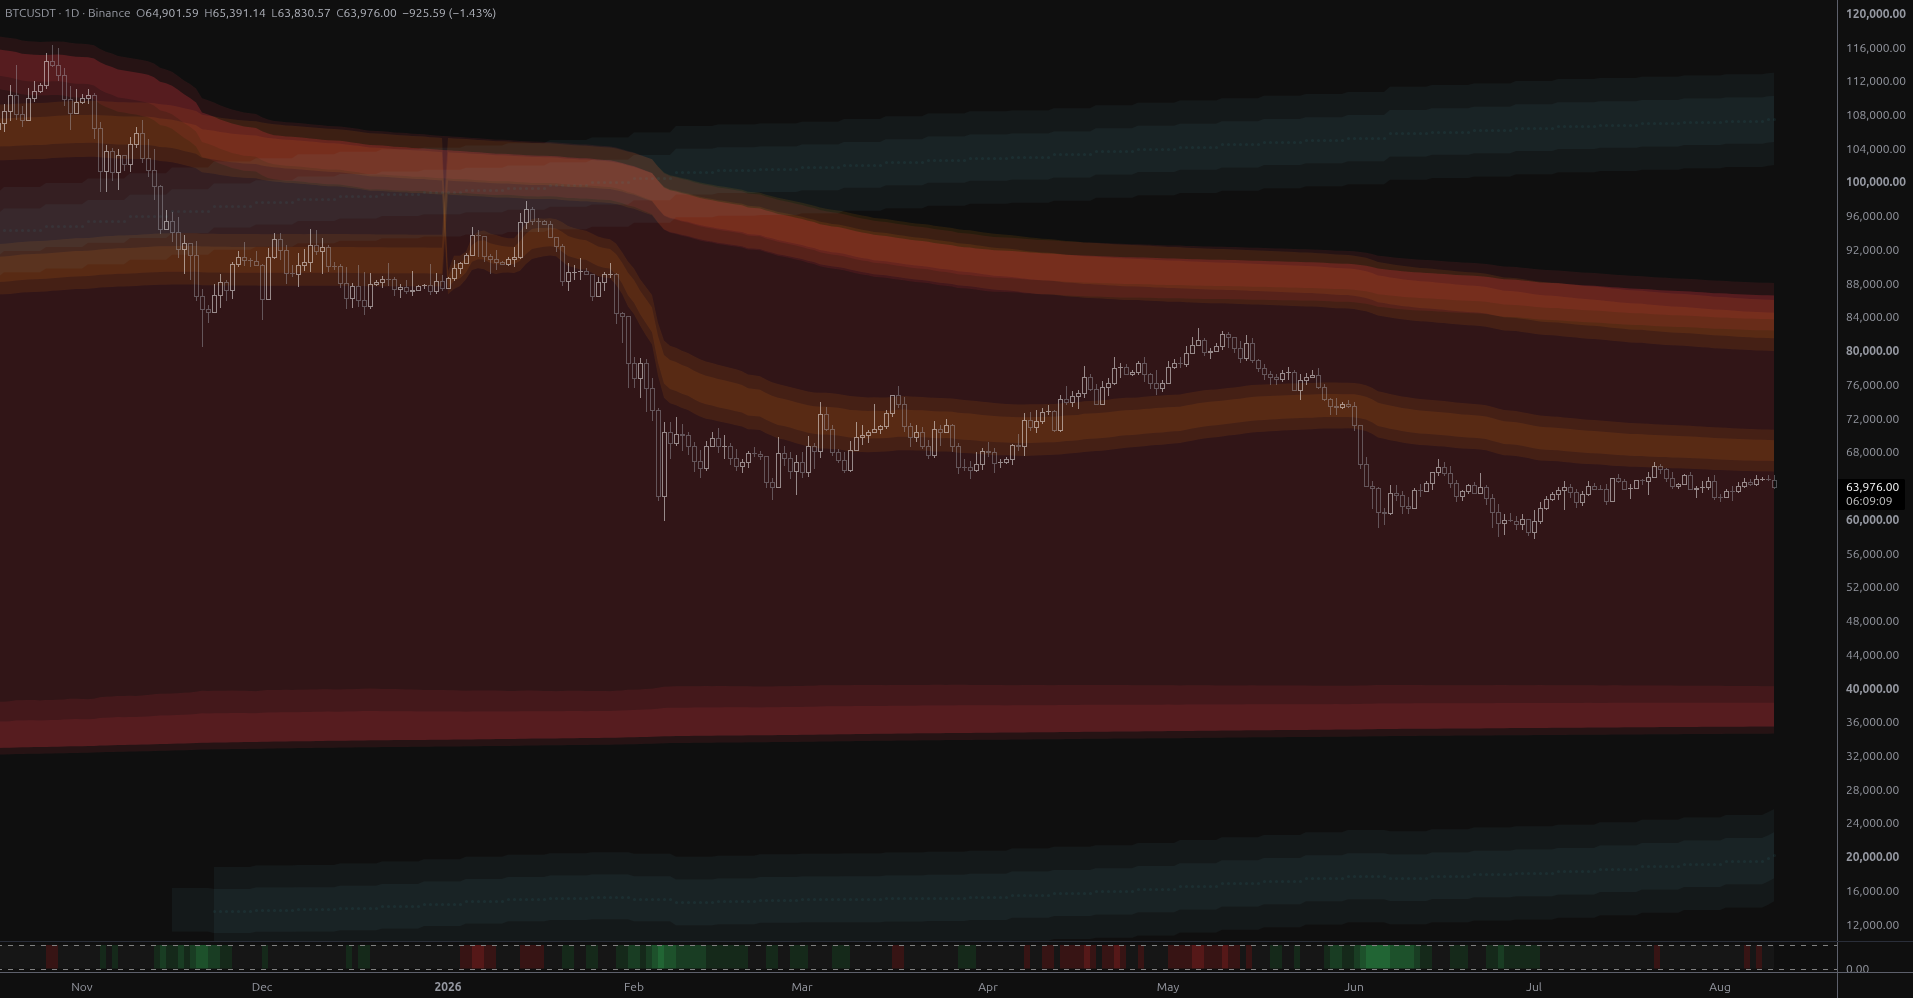
BTC Coils Just Under Its Yearly Value Rail
Bitcoin is coiling at $64,901 just 1.8% below its year-anchored value rail at $66,048, with structural bands far away in both directions. Ranked scenarios, key levels and the air pocket below $57,800.
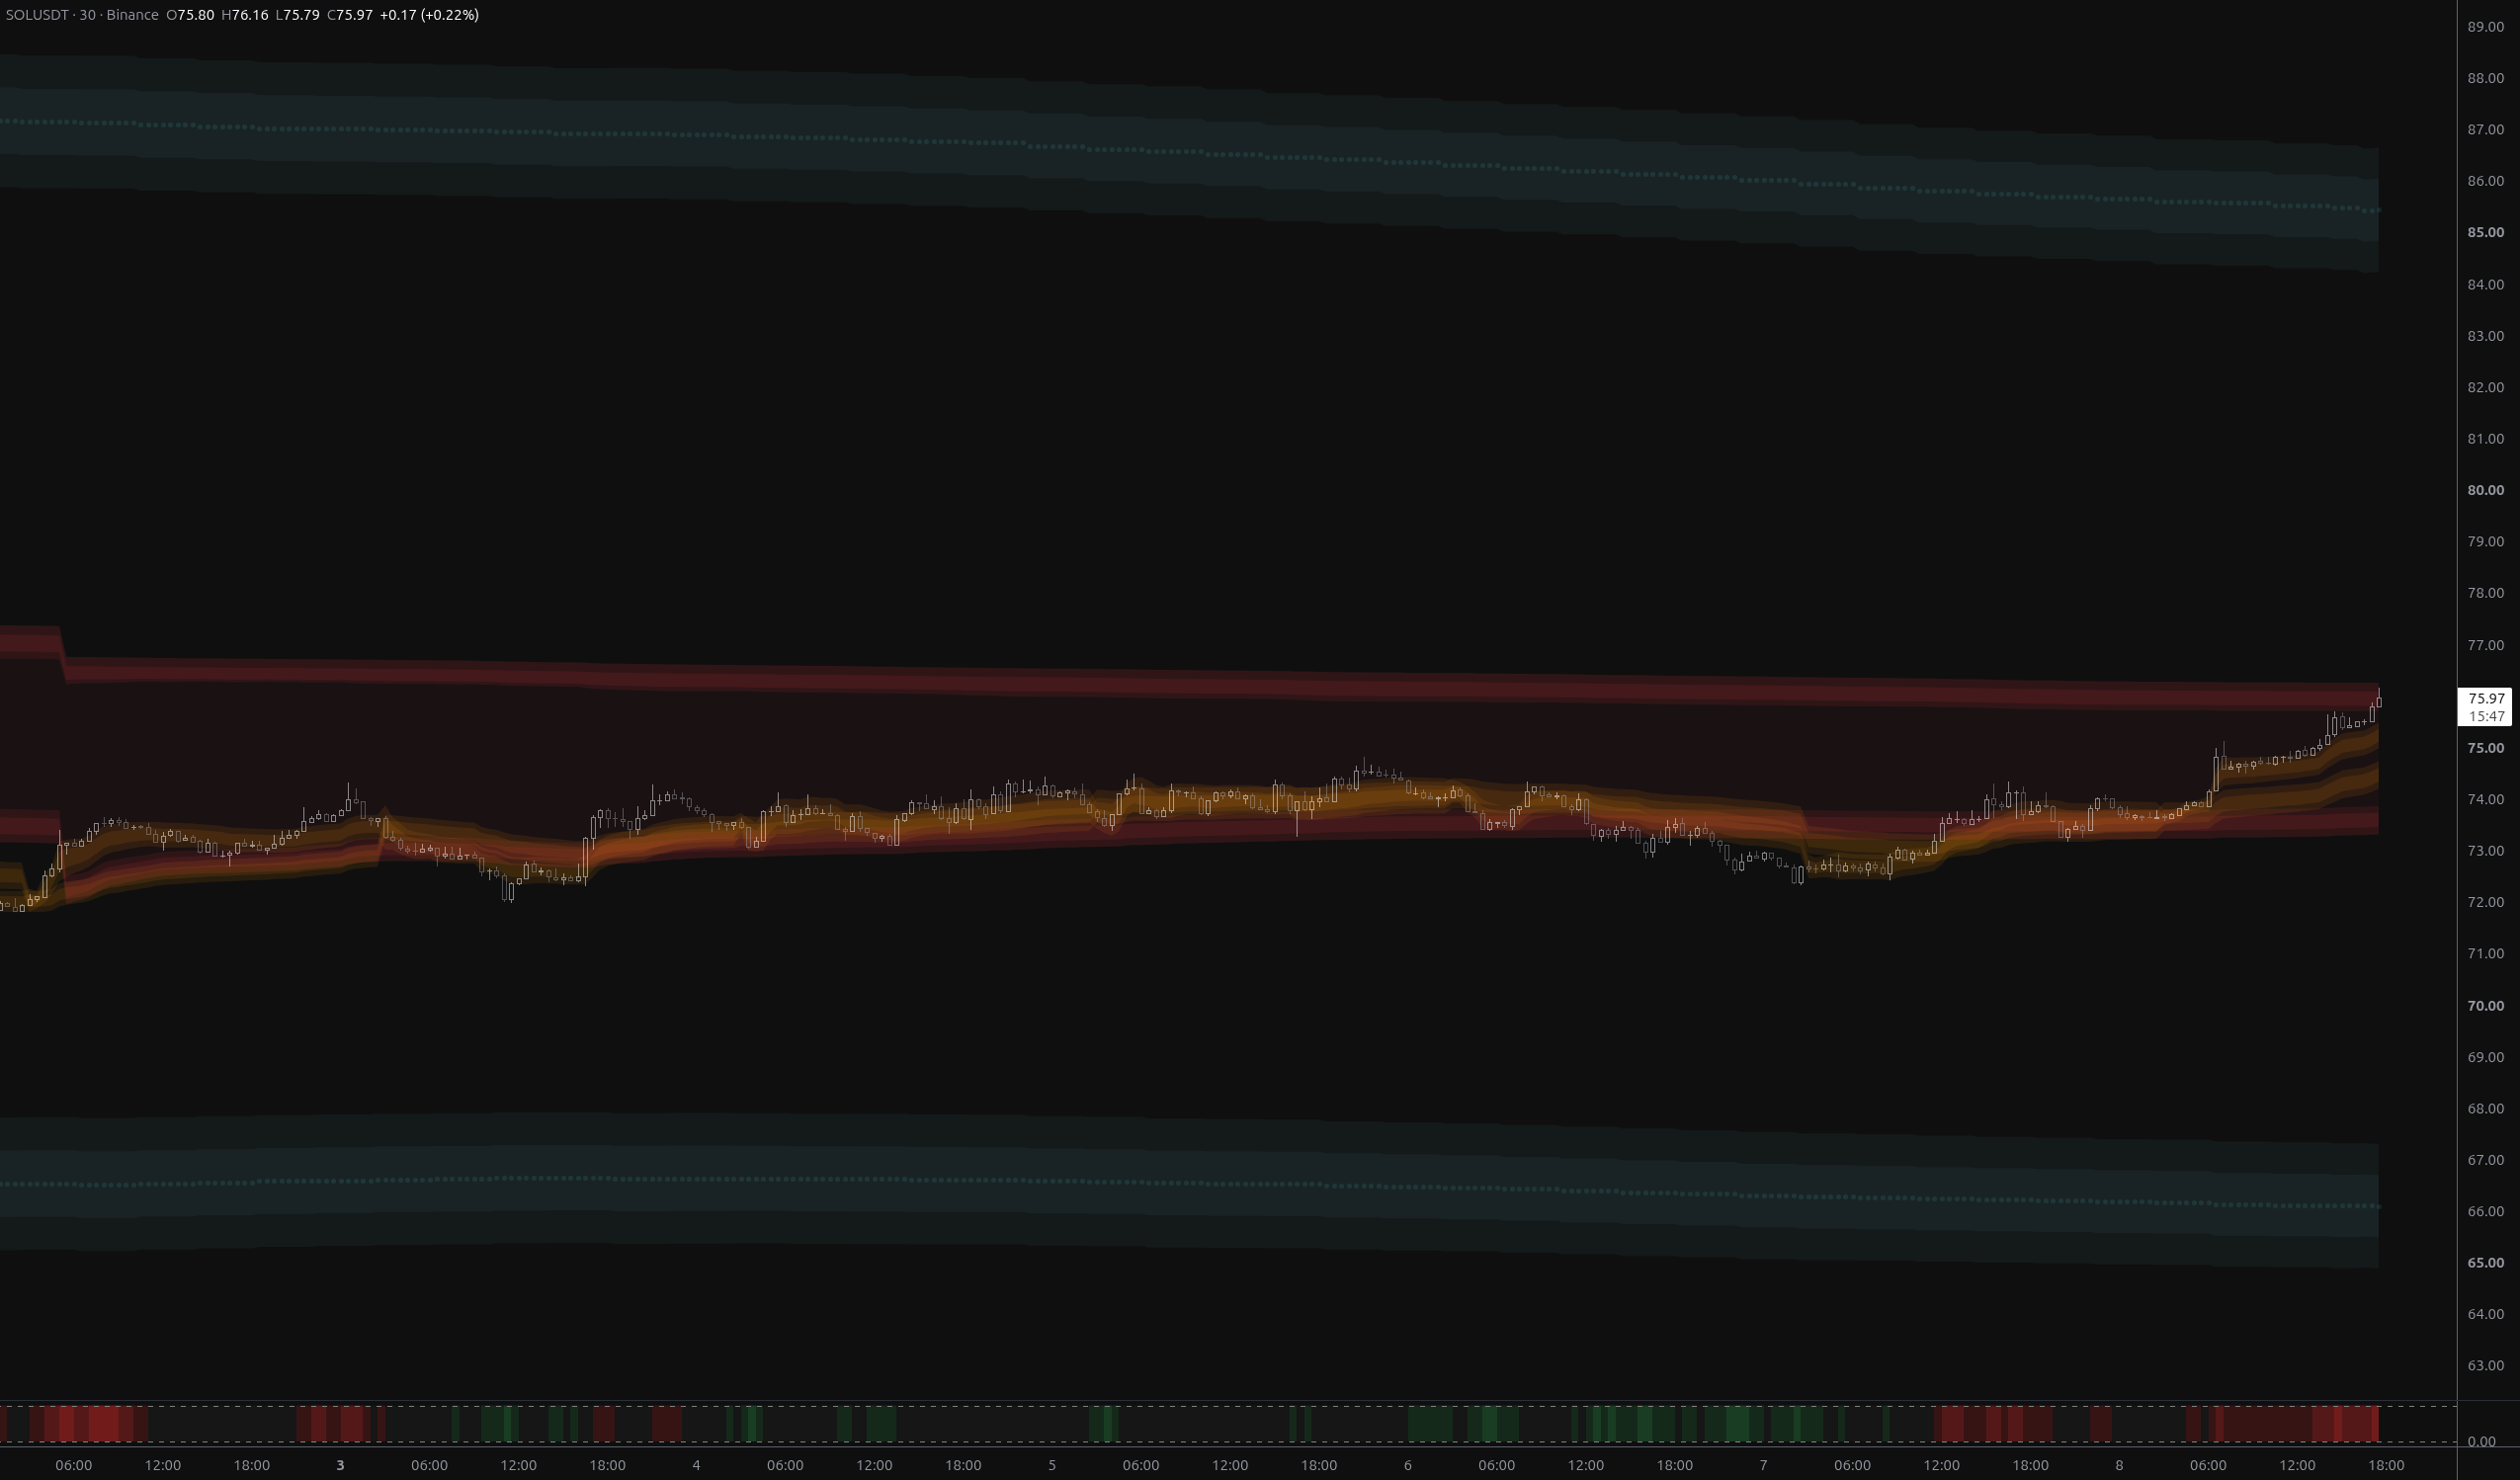
SOLUSDT: Bears Invalidated, $76.27 Now the Test
SOLUSDT has fully reversed the breakdown, reclaiming both fair-value envelopes and flipping its nearest structural band to above_1. The $75.73–$76.27 rail zone is now the decisive test.
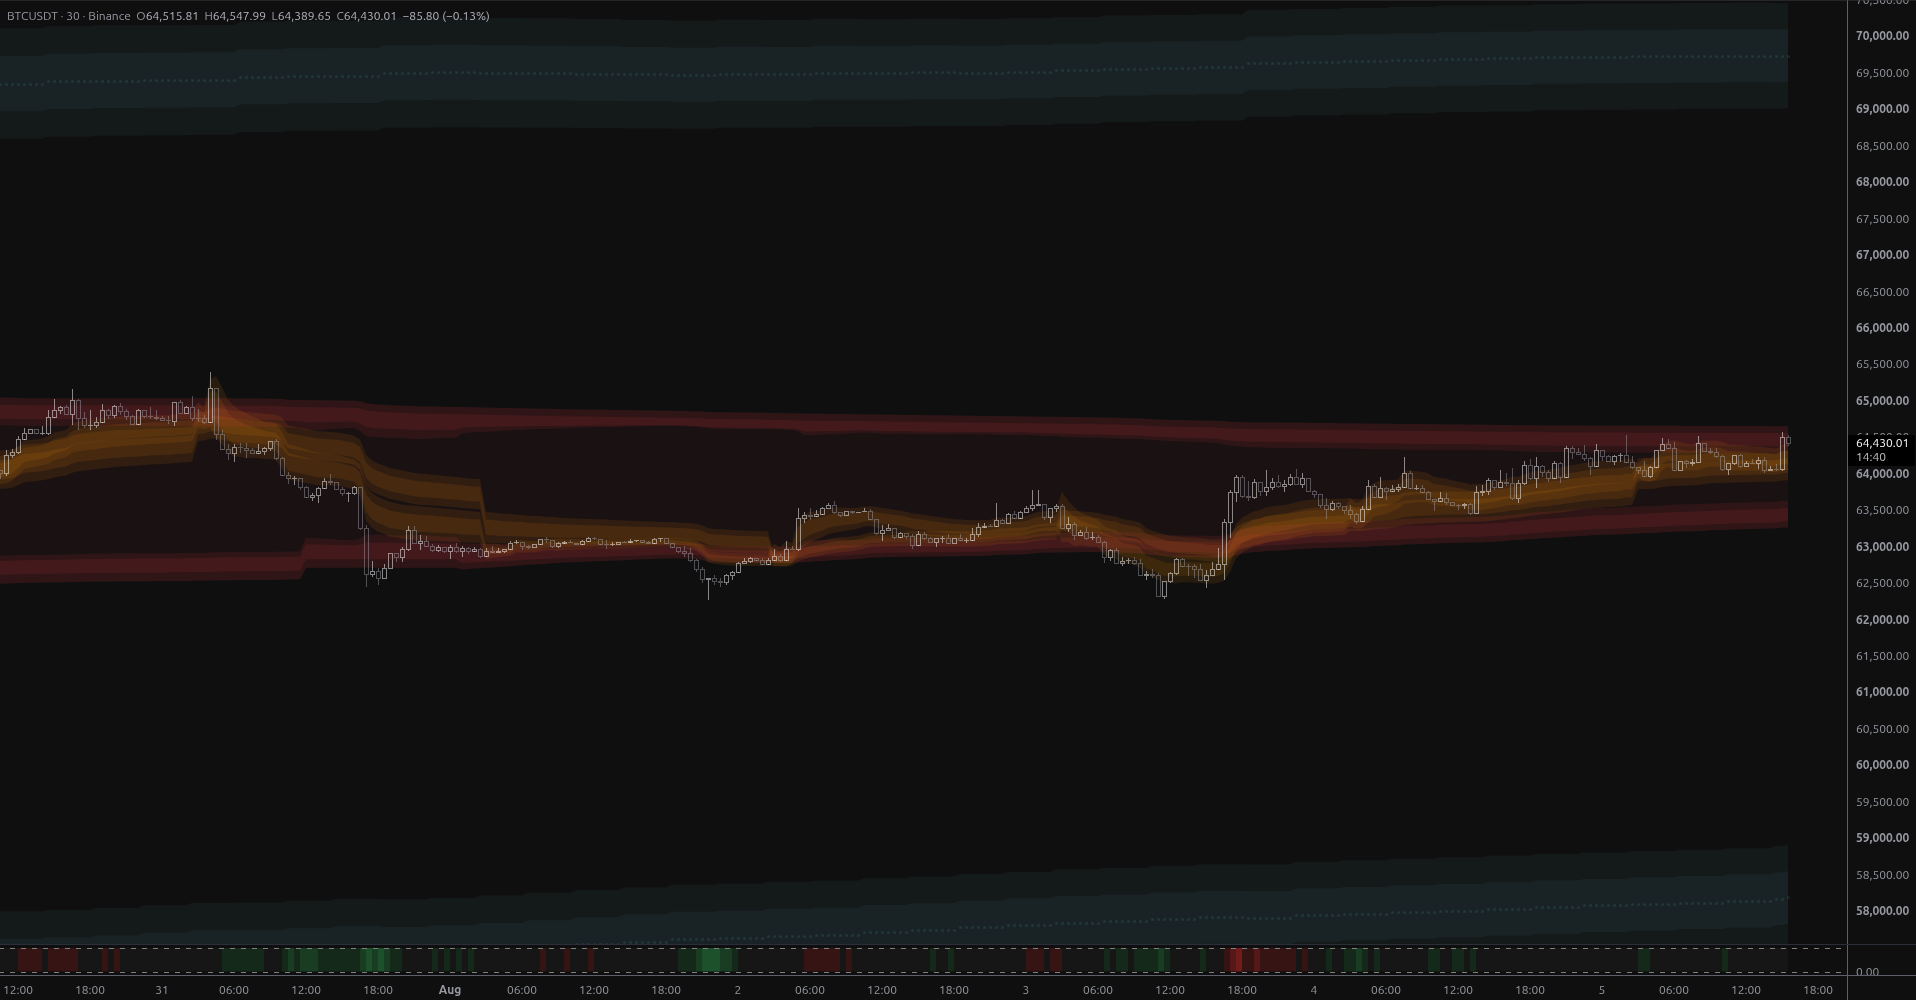
BTCUSDT: Breakout Into Open Structural Air
BTCUSDT broke above week-scale anchored value on 2.7x volume, leaving it stranded in structural open air with the nearest MSL band 6.8% overhead at $68,925 and no support until $59,012.
Connect With Us
Join our community of traders and stay updated with our latest tools and market insights.