
BTC Coils Just Under Its Yearly Value Rail
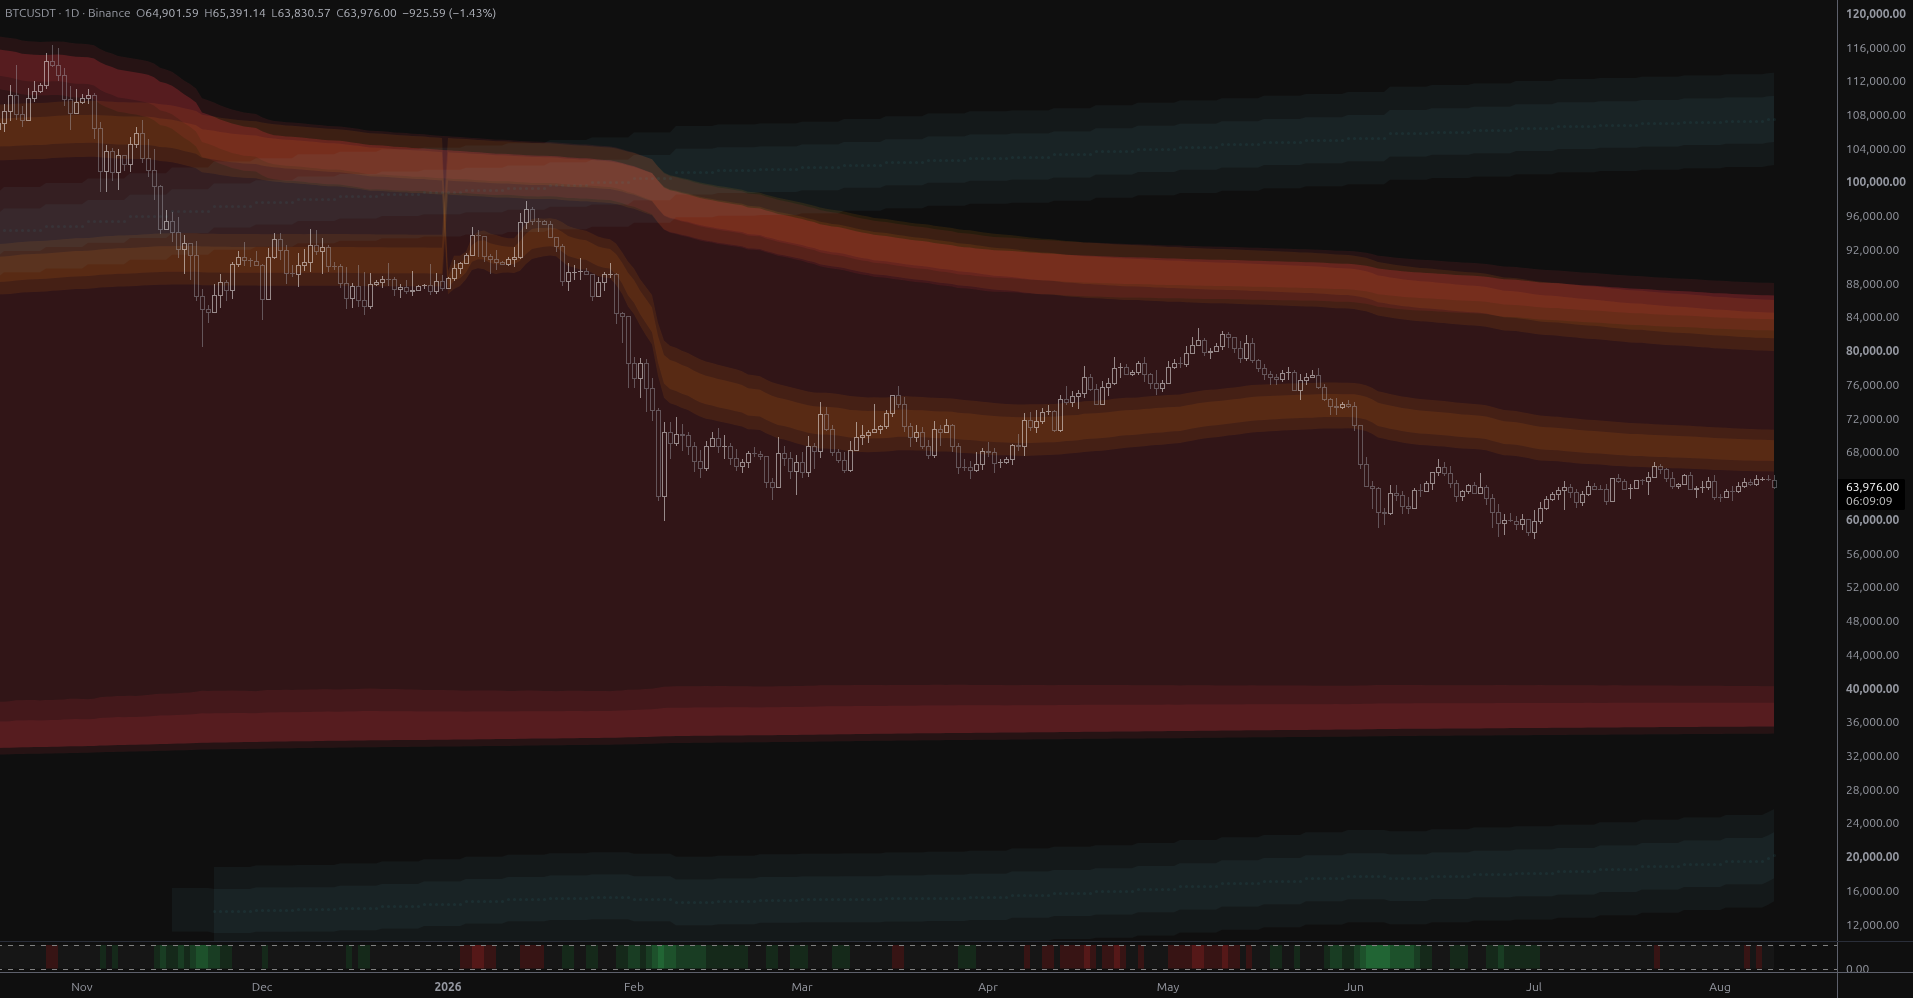
Bitcoin is coiling at $64,901 just 1.8% below its year-anchored value rail at $66,048, with structural bands far away in both directions. Ranked scenarios, key levels and the air pocket below $57,800.
The content on this page is for educational and informational purposes only and does not constitute financial advice. We are not licensed financial advisors or professional traders. Trading involves substantial risk of loss and is not suitable for every investor. Past performance is not indicative of future results. Always do your own research and consult a qualified financial professional before making any investment decisions.
Executive Summary
Bitcoin closes at $64,901.59 on the daily, pressed into a tight, low-volume coil directly beneath the lower rail of its year-anchored value envelope at $66,048. The larger picture remains a distribution-and-decline sequence that began from the $115,000 area: a chain of lower highs (115,466 → 97,924 → 82,850 → 66,956) and lower lows (86,100 → 60,000 → 57,800) that the swing engine still classifies as a clean downtrend (LH + LL). What has changed in the last month is the character of the decline: range instead of impulse, volume at roughly a third of average, momentum readings flat, and a structural state that has just rotated from accumulation into exhaustion. This is a market resting, not a market trending — and it is resting immediately under the level that separates "below value" from "back inside value."
Trend Overview: Ten Months of Lower Highs
The data window traces the full arc. From the $110,000–$116,000 shelf, price lost the top of the year-anchored envelope, spent November grinding into the mid-$80,000s, staged a January recovery attempt to $97,924, and then broke violently: the sequence of sessions that printed lows at $75,700, $72,945 and finally $60,000 came with the heaviest volume in the entire dataset (one session over 106,000 units, several times the twenty-day average). That capitulation established the first durable floor.
The spring rebound carried price to $82,850 — and stalled almost exactly at the upper rail of the wide pivot-anchored envelope, a confluence discussed below. From there the market rolled over again through May and June, culminating in the $57,800 swing low. The rally off that low reached $66,956 before failing, and the market has since spent roughly a month oscillating between $62,466 and $65,474.
Two bearish engulfing candles inside the last fortnight (nine and thirteen bars ago) show sellers still capable of reclaiming ground quickly. But the most recent session is a doji with a long upper wick topping out at $65,474 — a rejection, yes, but a rejection on the lowest relative volume in the sample (0.32x average). Sellers are not pressing; buyers are not committing.
Anchored Value: The Decisive Line at $66,048
Year-anchored envelope — price is outside, but barely
The slower, year-anchored channel is the one that matters tactically right now. Price sits in the below_bottom zone and has held it for 19 consecutive bars, with the near rail just 1.77% overhead at $66,048. Above that rail the ladder is:
- $66,048 — lower rail of the bottom band (re-entry trigger)
- $68,500 — the lowest year-anchored fair-value line itself
- $70,952 — upper rail of the bottom band; a close above this puts price genuinely back inside yearly value
- $81,536 – $86,441 — the top band of the yearly envelope, where the most stretched anchor places resistance
The important nuance: price is only marginally outside. Nineteen bars of shallow rejection beneath a rail is not the same as a collapse away from it. Markets that cannot fall away from a rail they have lost usually resolve by testing it again, and the current coil is exactly that setup. Equally, a market that spends nineteen bars unable to reclaim a rail 1.8% away is not strong.
Pivot-anchored envelope — balance, not stretch
The pivot-anchored view is a much wider, much older read: it has run without re-anchoring for hundreds of bars, and its outer envelope currently spans roughly $34,753 at the bottom rail to $88,384 at the top. Price sits in the open middle of it at just over half of envelope width, and has held that between zone for 280 consecutive bars. Translation: on the structural, multi-anchor view, Bitcoin is neither stretched nor cheap — it is in a long balance, with 27.6% of room to the nearest upper rail ($82,786) and 37.8% to the nearest lower rail ($40,350).
The single most instructive confluence in the whole dataset lives on the upside: the pivot envelope's upper rail at $82,786, its highest anchored line at $85,430, the yearly upper band ($81,536–$86,441), and the actual May swing high at $82,850 all stack in the same zone. That is the ceiling of this bear phase, and any recovery narrative has to be measured against it, not against local highs.
MSL Band Structure: An Air Pocket Beneath the Market
The structural grid is currently unusually unhelpful in the near field — and that is the message. The nearest band is below_1 ($14,572 – $25,505, midline $20,039), which price sits far above at the very top of its positional range, while the next band up, above_1 ($102,039 – $112,972, midline $107,506), is roughly 57% away. Band width has expanded to around 55%, and the nearest-band label flipped downward seven bars ago as the grid recentred.
Practically, that means Bitcoin is trading in structural open space. There is no grid level within striking distance in either direction. The consequences cut both ways:
- Upside: the entire $102,039–$112,972 above_1 band is out of reach for this phase. Rallies must be judged against the anchored-VWAP rails, not against the grid.
- Downside: below the July swing low at $57,800, the next structurally agreed support is not the grid — it is the pivot envelope's bottom band at $40,350 / $36,437 / $34,753, with the below_1 ceiling at $25,505 beyond it. That is the air pocket, and it is why the $57,800 low deserves to be treated as the line that defines the whole medium-term thesis.
The historical band record supports this reading: price spent the entire autumn-to-spring stretch labelled against above_1 while trading beneath it, i.e. falling away from structure rather than travelling band to band. That is a distributive, not a rotational, market.
Regime and Structural Context
The regime model is decisively in mild bearish and has held it for 25 bars with maximum confidence. Notably it is mild, not strong: the strong-bearish clusters coincided precisely with the February and June capitulations, and the model has not returned to them despite price sitting near the lows. Bearish bias, decaying bearish energy.
The structural classifier has just rotated accumulation → exhaustion and holds exhaustion with full confidence. Read literally, that describes a market extended above its support reference with momentum fading — consistent with a rebound off $57,800 that has run out of fuel below a hard ceiling. Combined with a flat, slightly falling momentum reading (neutral direction, zero intensity, eight bars in the same posture) and 0.32x volume, the setup argues for continuation of range with downward drift rather than either a trend leg or a reversal.
Scenarios, Ranked by Likelihood
1. Most likely — Coil persists, capped by $66,048 / $66,956
Price continues to oscillate between roughly $62,466 and $66,956, with repeated failures at the yearly lower rail. Compression at this volume rarely lasts long, so expect the range to tighten further before it breaks. Invalidation: a daily close outside $62,466–$66,956 accompanied by relative volume back above average.
2. Second — Bearish resolution and a retest of the July low
Rejection at $66,048 rolls the market back to $62,466, then $59,130 and the $57,800 swing low. This is the path most consistent with the mild-bearish regime, the exhaustion label and an unbroken LH/LL sequence. A decisive daily close below $57,800 is the genuinely dangerous event, because the next multi-anchor support does not appear until the $40,350–$34,753 pivot band, with the below_1 ceiling at $25,505 as the deeper structural magnet. Invalidation: reclaim and hold of $66,048 for several sessions.
3. Third — Base completes, price re-enters yearly value
A volume-backed close above $66,956 would print the first higher high of this sequence and break the LH pattern. That opens $68,500 (lowest yearly fair-value line) and then $70,952, the top of the yearly bottom band. Holding above $70,952 would convert the picture from "below value" to "inside value" and put the $81,536–$86,441 / $82,786–$85,430 ceiling cluster into play as the phase objective. Invalidation: failure back beneath $66,048 after any such breakout.
4. Least likely — Structural regime change toward above_1
A sustained advance into the above_1 band ($102,039–$112,972) is not a scenario for this quarter. It would require the regime to leave bearish territory entirely, the pivot envelope's upper rails to be reclaimed, and volume to expand persistently. Worth naming only as the marker of what a true bull-phase transition would look like.
Key Levels
| Level | Source | Role |
|---|---|---|
| $112,972 / $107,506 / $102,039 | MSL above_1 (hi / mid / lo) | Out-of-reach structural objective |
| $88,384 / $85,430 / $82,786 | Pivot envelope top band | Bear-phase ceiling cluster |
| $86,441 / $83,424 / $81,536 | Yearly envelope top band | Confluence with above; $82,850 swing high |
| $70,952 | Yearly bottom band, upper rail | "Back inside value" confirmation |
| $68,500 | Lowest yearly anchored value line | First real resistance above the rail |
| $66,956 | Last swing high | Breaks the lower-high sequence |
| $66,048 | Yearly bottom band, lower rail | The pivot of the whole setup |
| $64,901 | Current close | 1.77% below the rail, 19 bars outside |
| $62,466 | Recent range low | First support, range floor |
| $59,130 / $57,800 | Prior / last swing low | Thesis-defining support |
| $40,350 / $36,437 / $34,753 | Pivot envelope bottom band | Next multi-anchor support below the air pocket |
| $25,505 / $20,039 / $14,572 | MSL below_1 (hi / mid / lo) | Deep structural grid reference |
What to Watch
- Volume expansion.
- Zone change on the yearly envelope. Nineteen bars below the bottom rail; a shift back to "inside the bottom band" is the earliest objective evidence that the decline is maturing into a base.
- Structural label. A rotation out of exhaustion back into accumulation or support base would materially improve the case for scenario three; a slide toward distribution-type behaviour would reinforce scenario two.
- Regime intensity. Watch for any return to the strong-bearish cluster — historically that has coincided with the impulsive legs, not the ranges.
This is market analysis, not a trade recommendation. The structural read is bearish-but-tiring: respect the $66,048 rail as the arbiter, and treat $57,800 as the level below which the map genuinely runs out of nearby support.
Featured Indicators
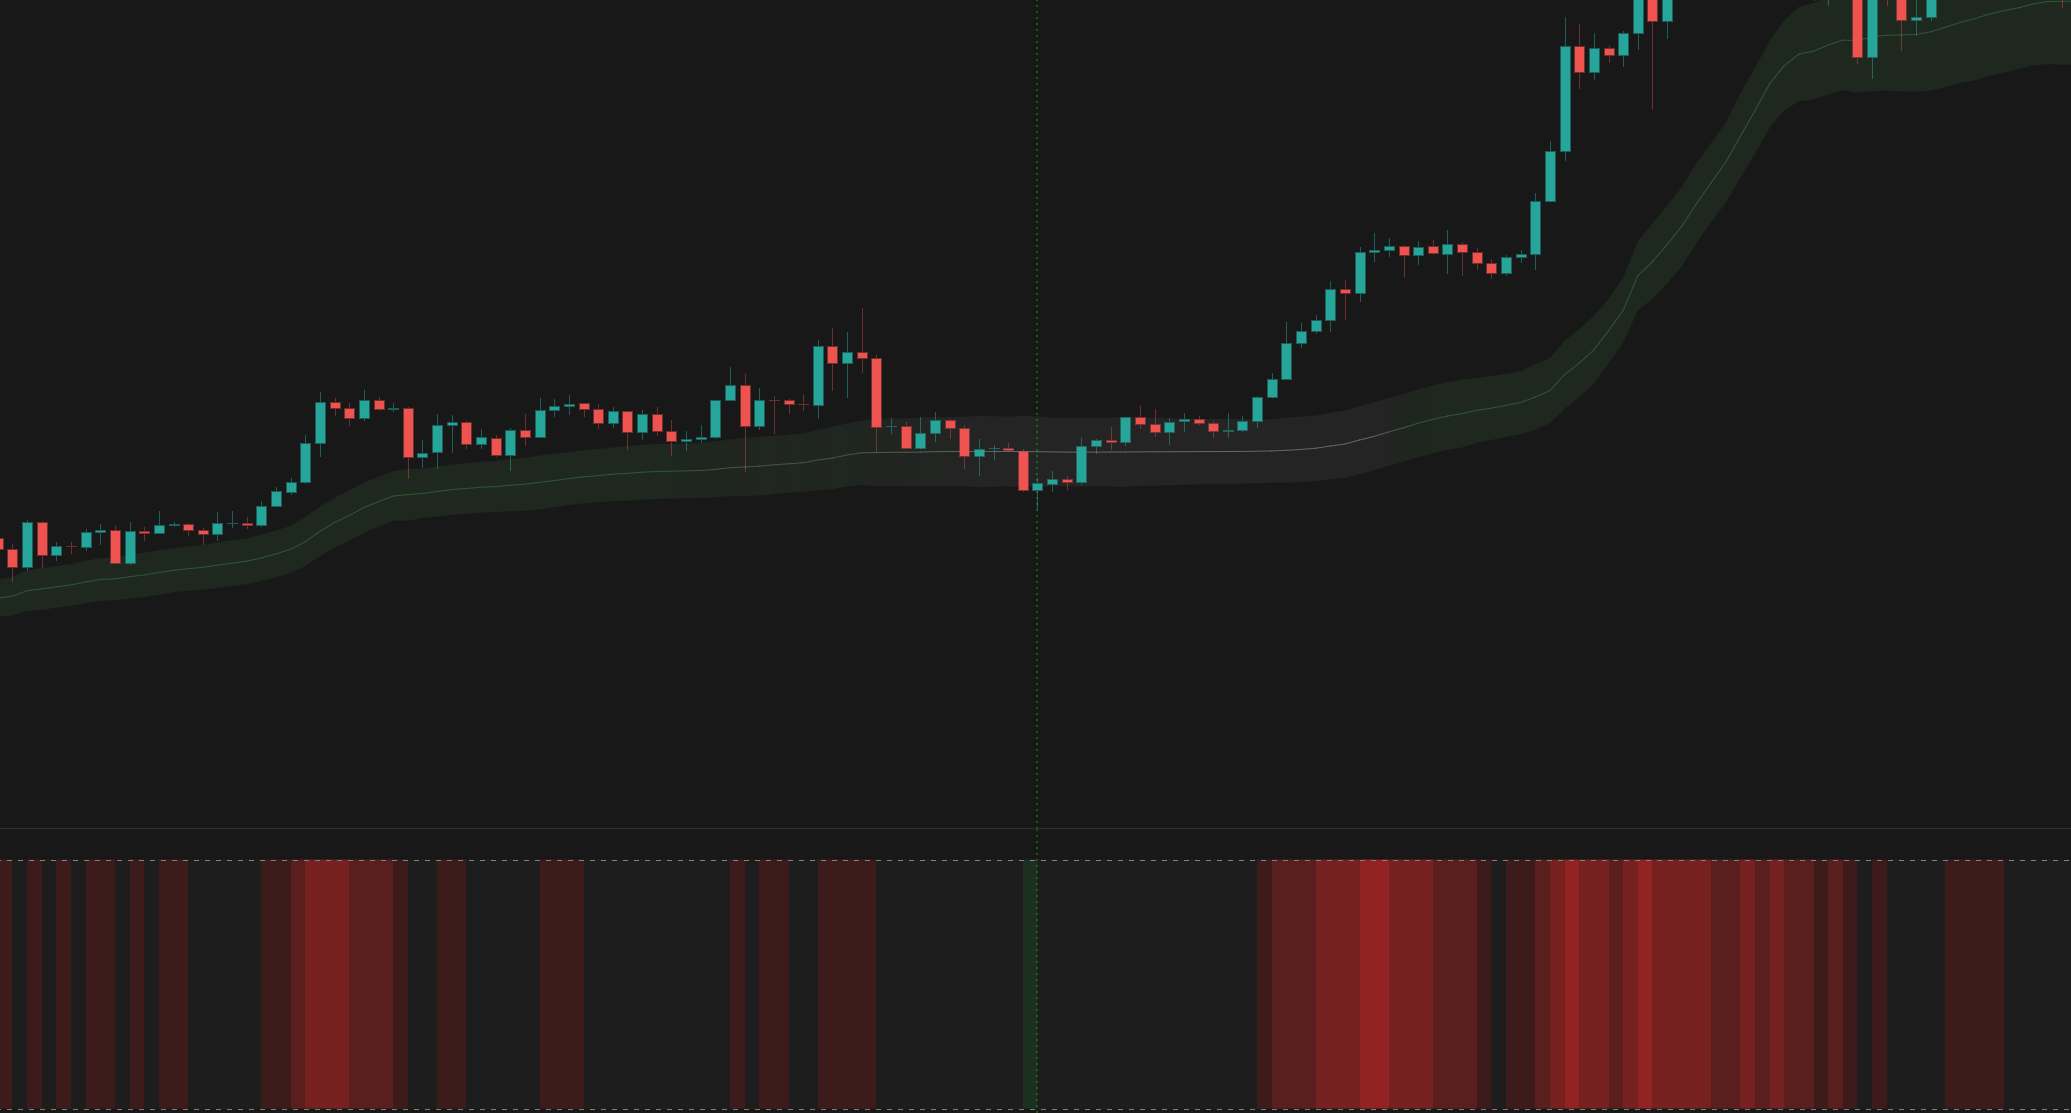
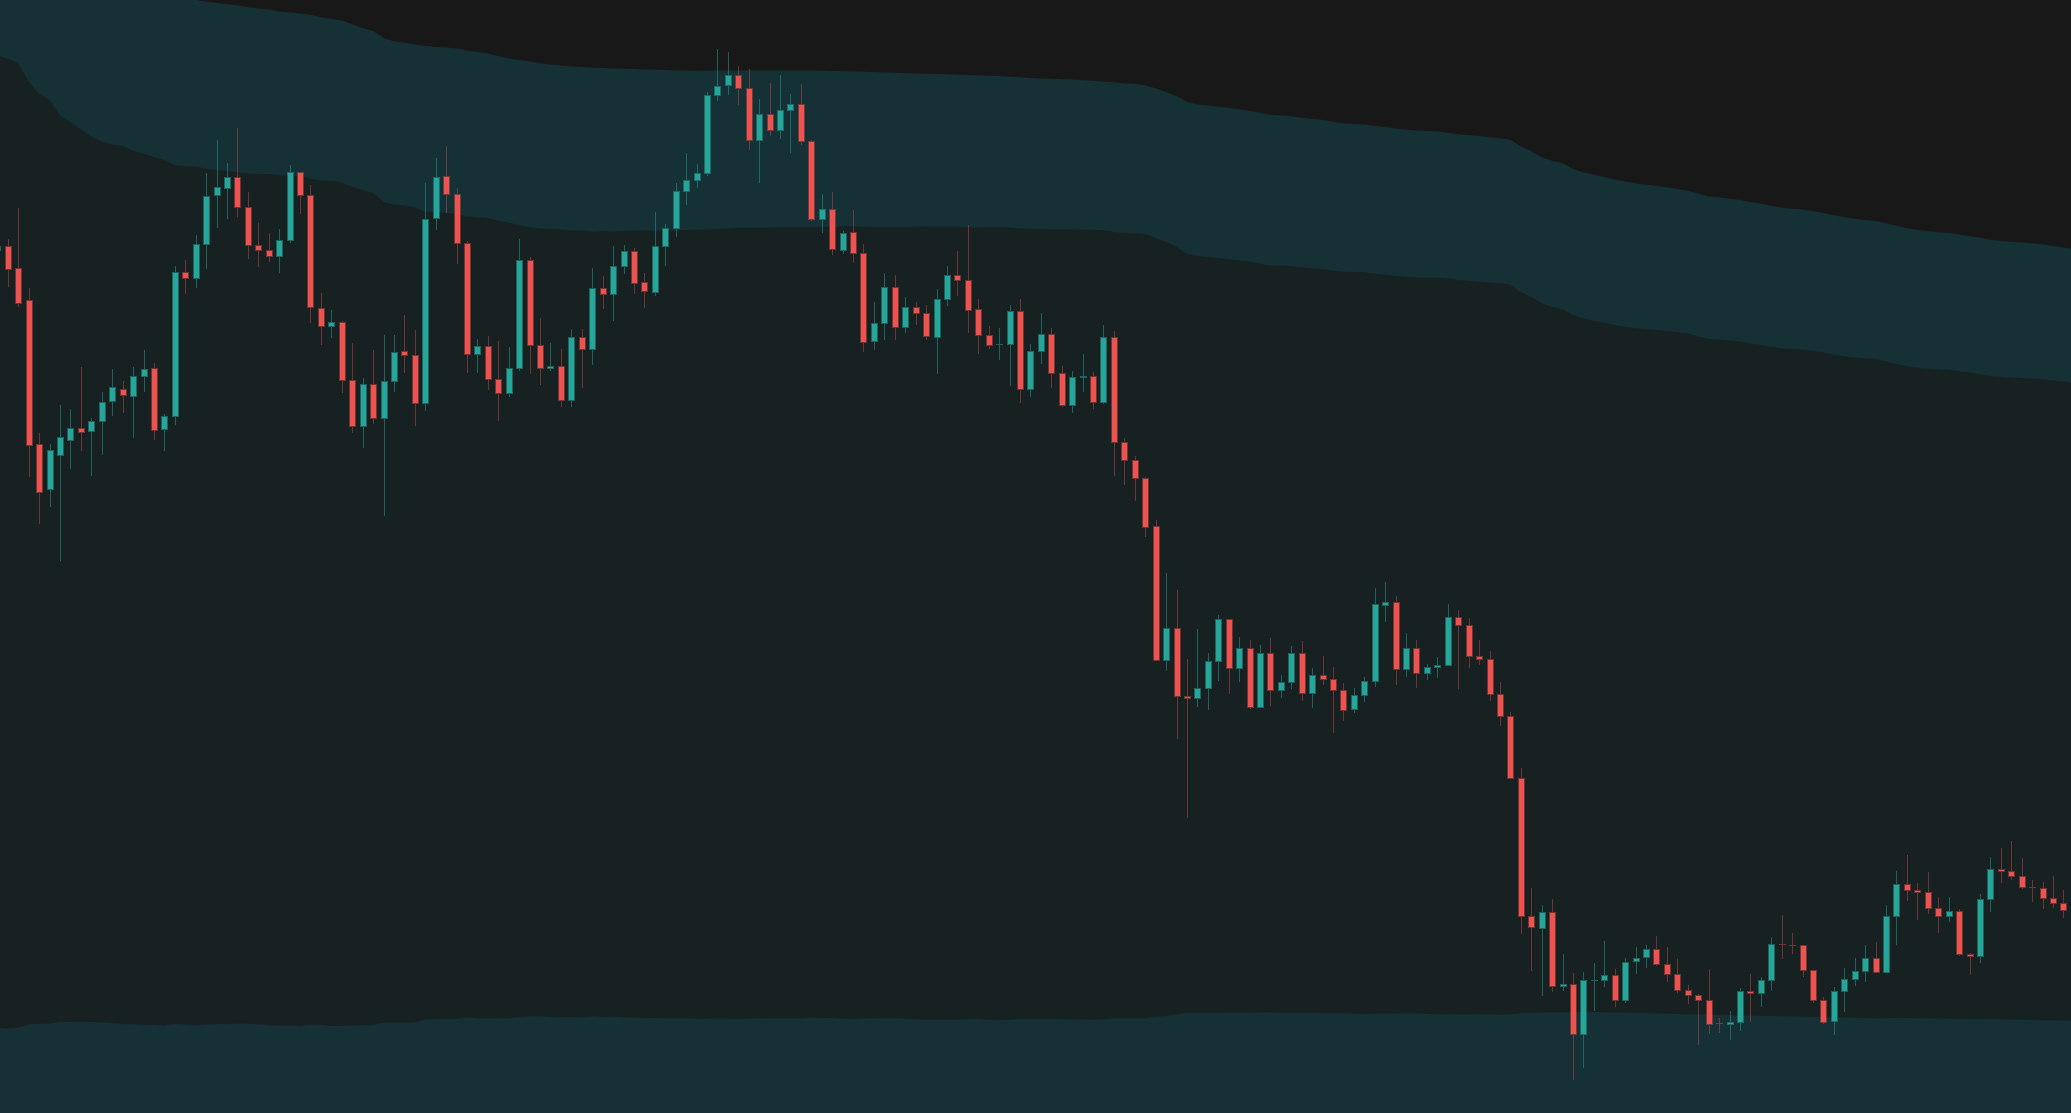
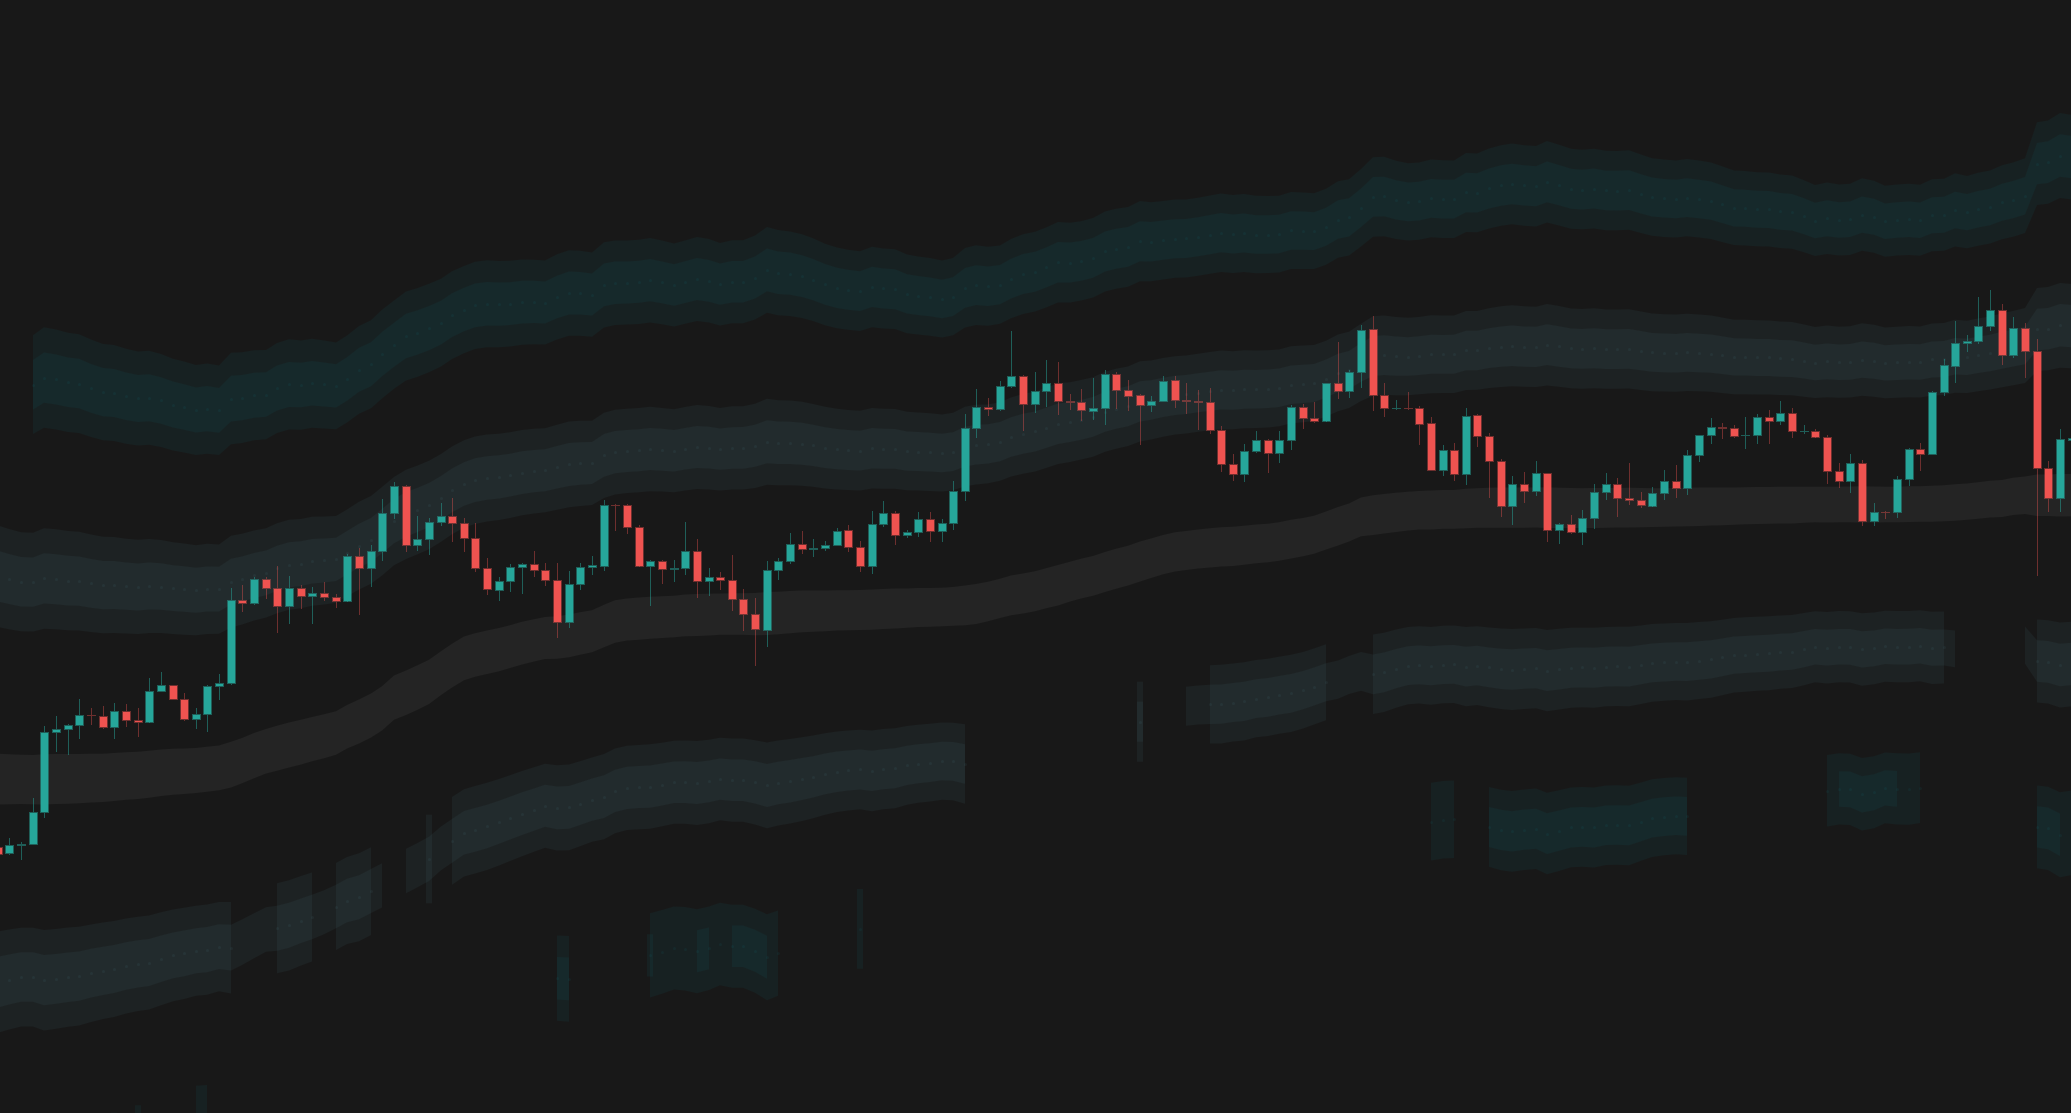
The indicators referenced in this trading idea.
Related Ideas
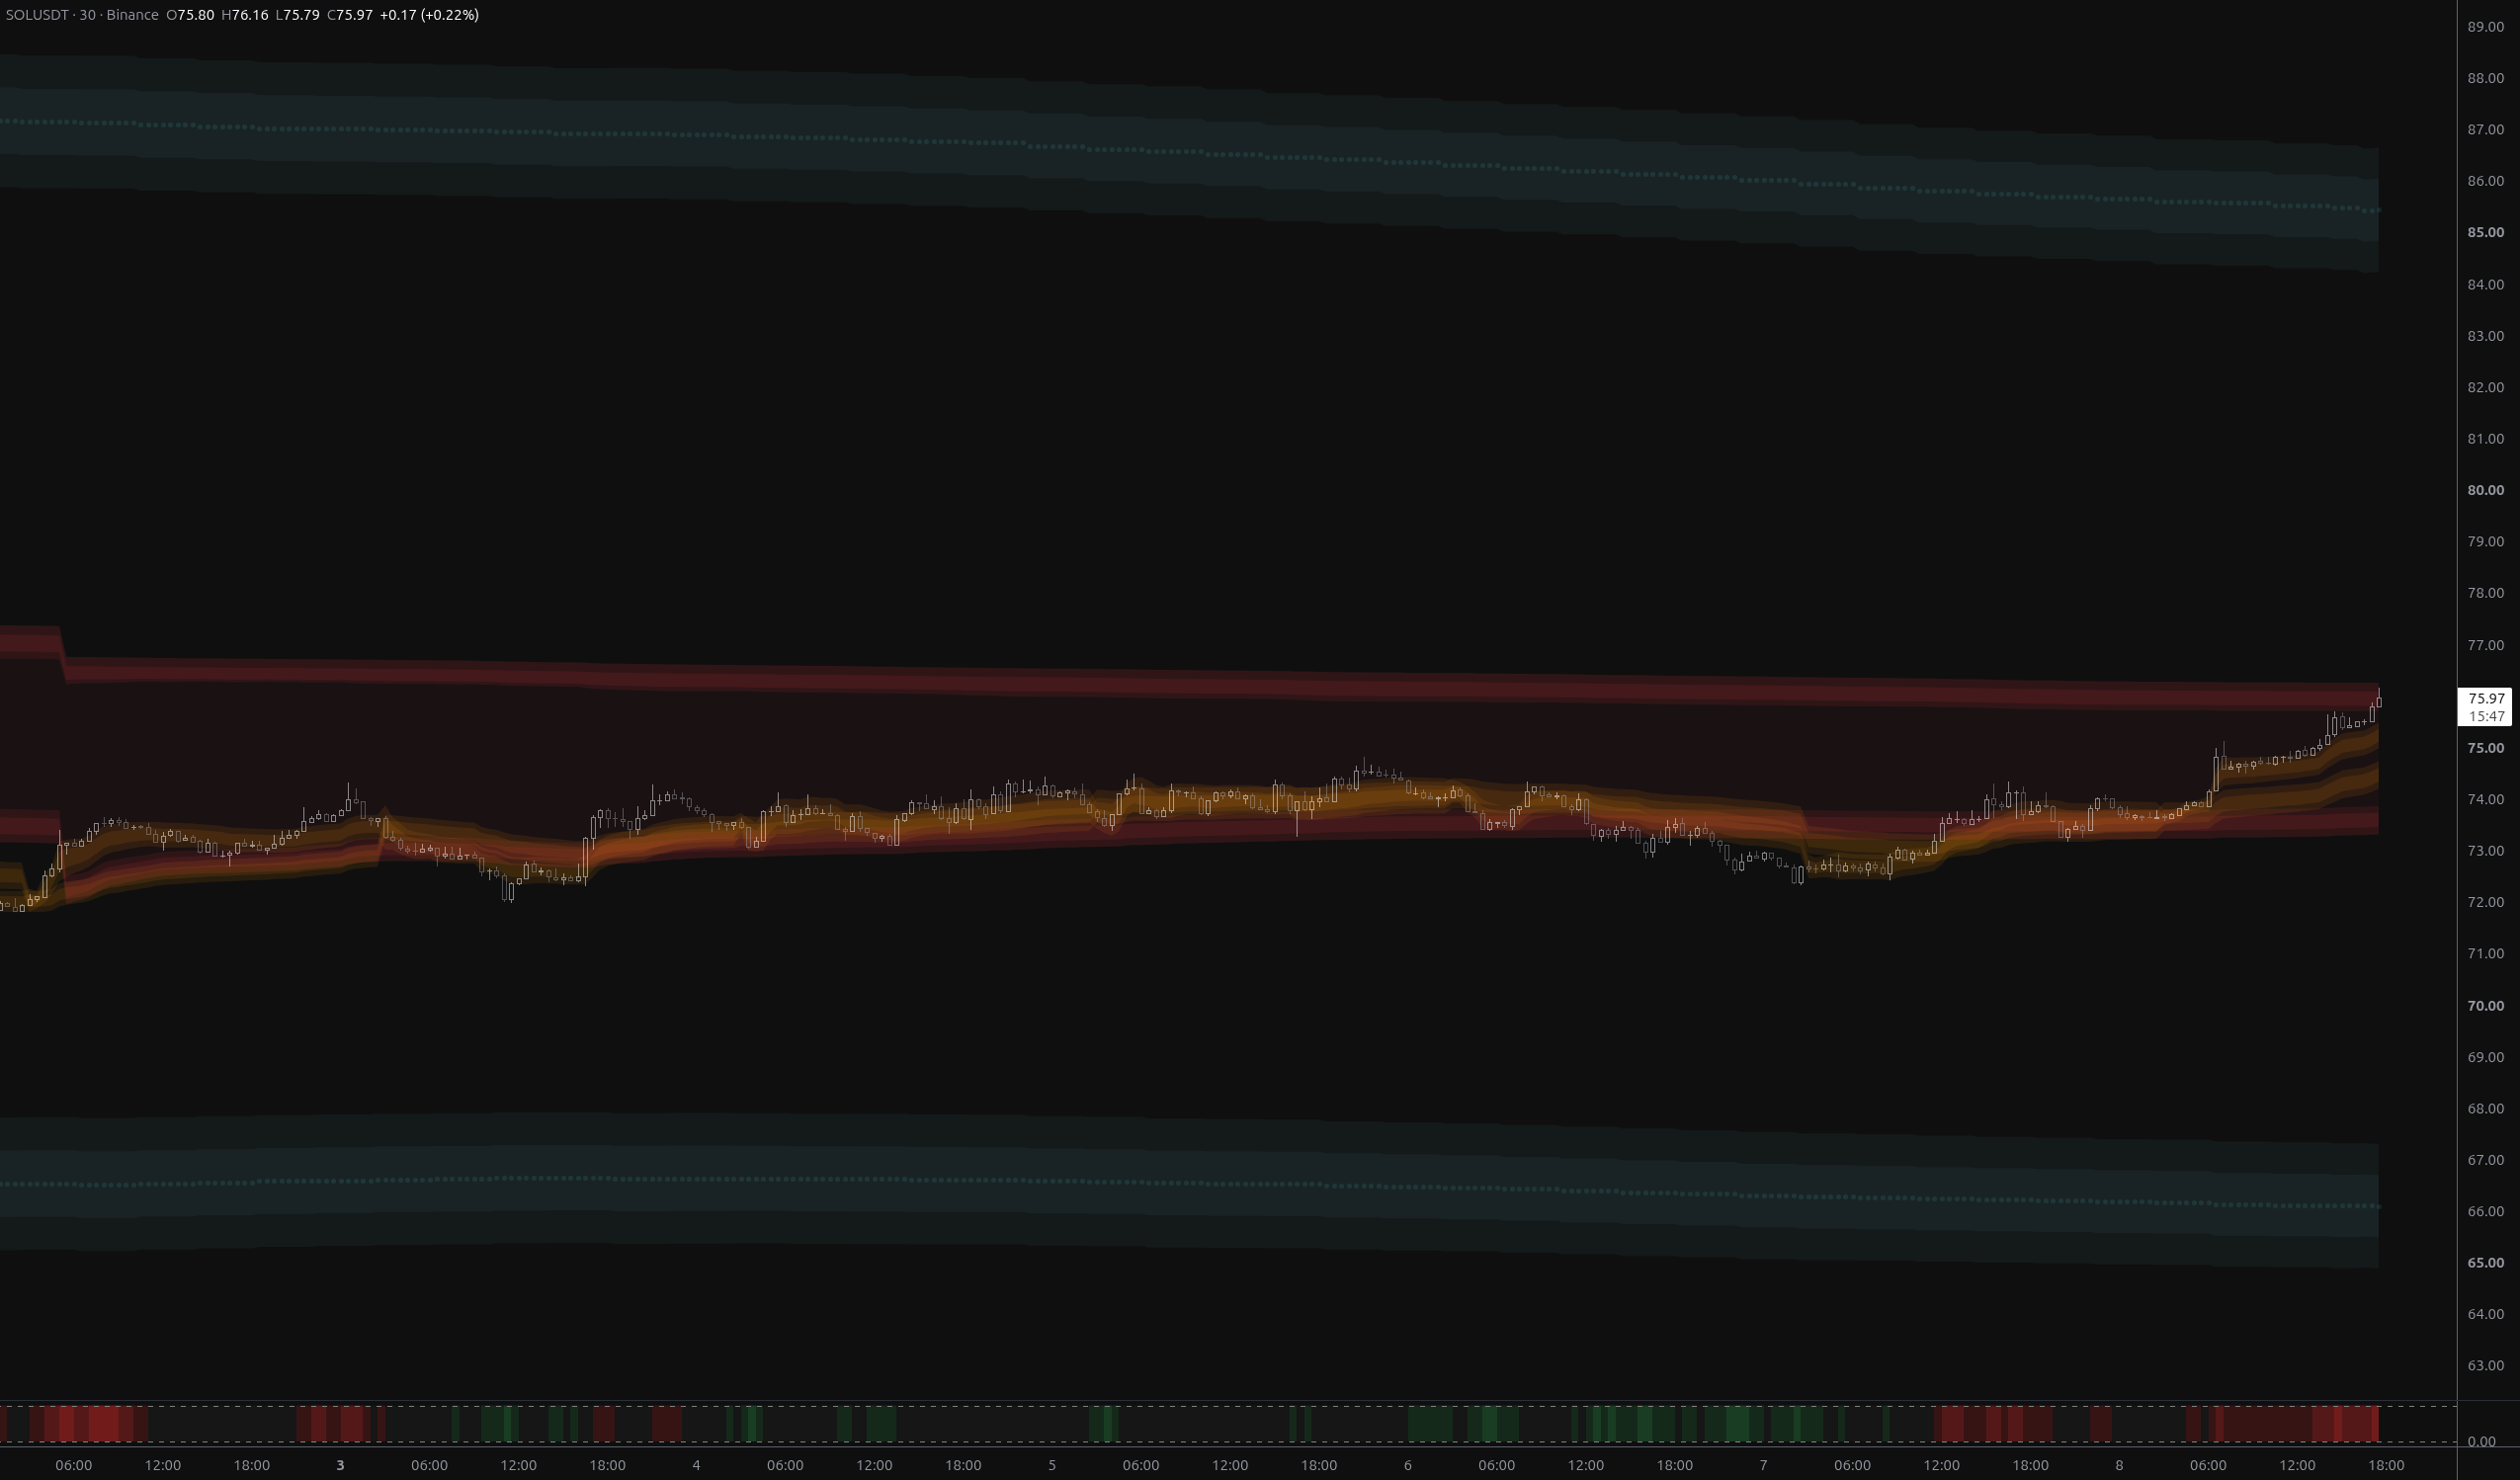
SOLUSDT: Bears Invalidated, $76.27 Now the Test
SOLUSDT has fully reversed the breakdown, reclaiming both fair-value envelopes and flipping its nearest structural band to above_1. The $75.73–$76.27 rail zone is now the decisive test.
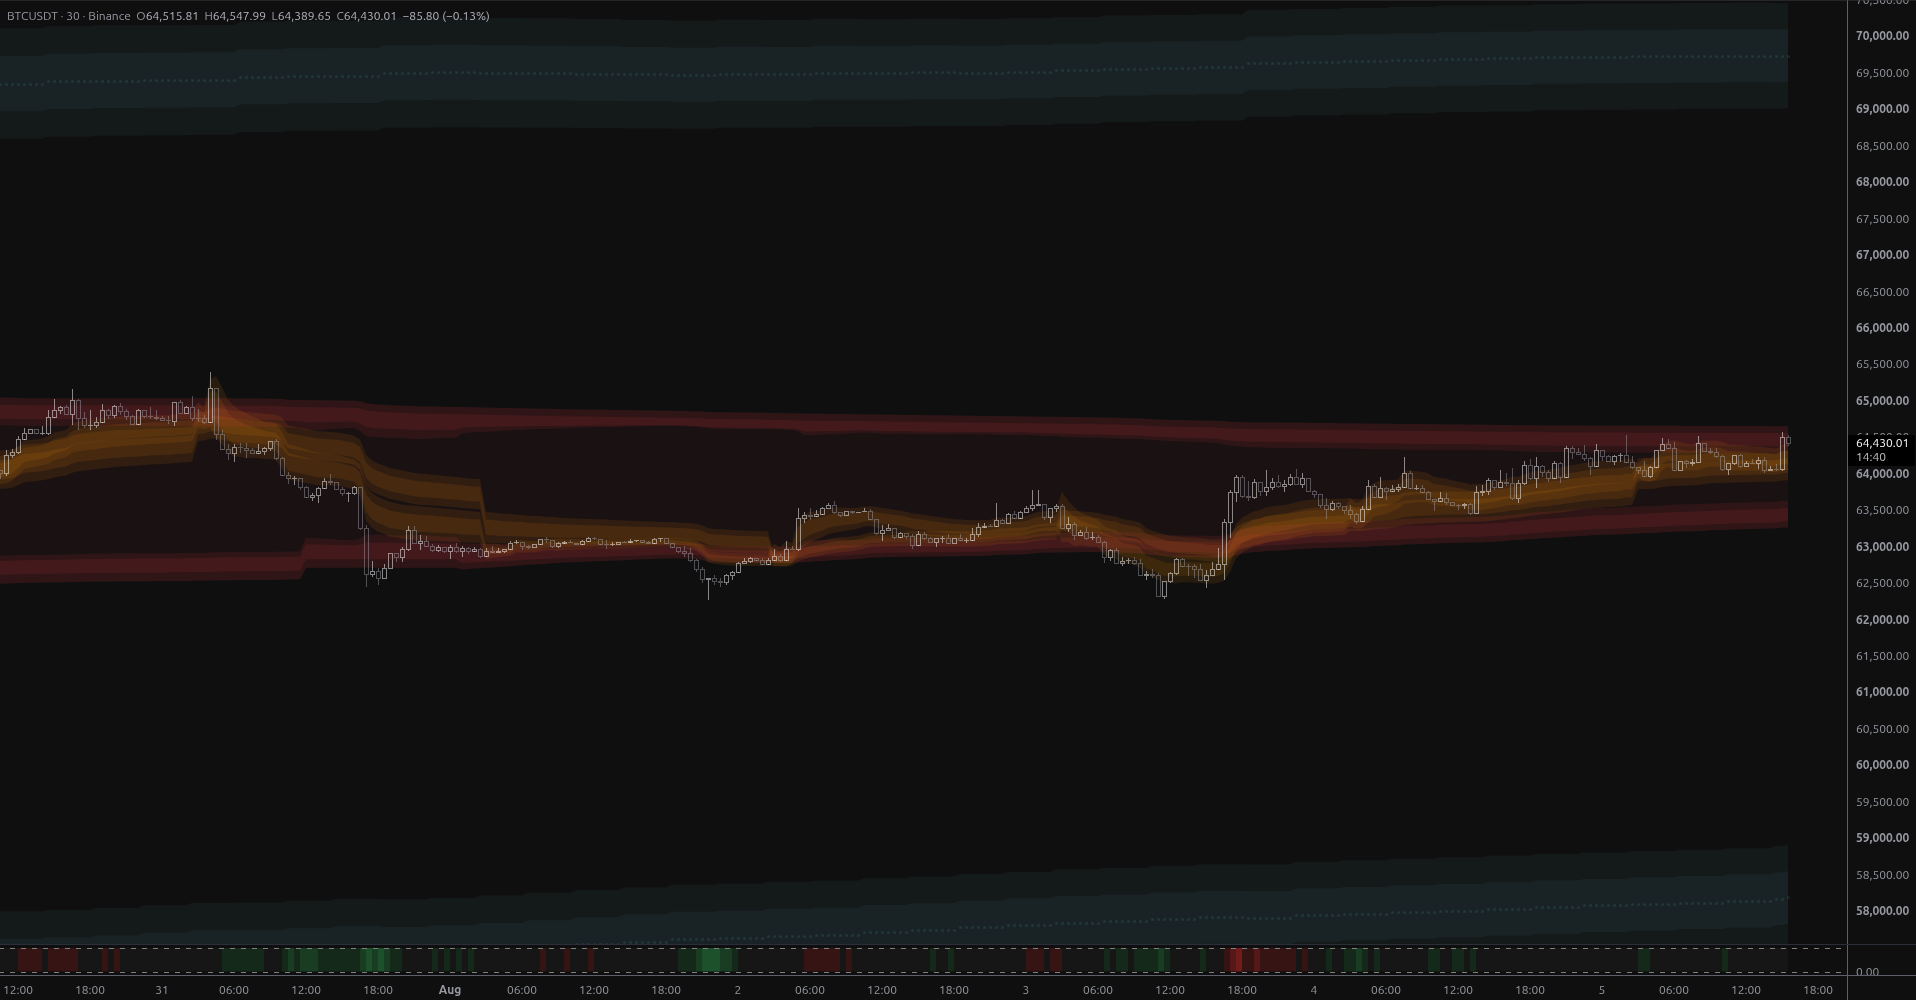
BTCUSDT: Breakout Into Open Structural Air
BTCUSDT broke above week-scale anchored value on 2.7x volume, leaving it stranded in structural open air with the nearest MSL band 6.8% overhead at $68,925 and no support until $59,012.
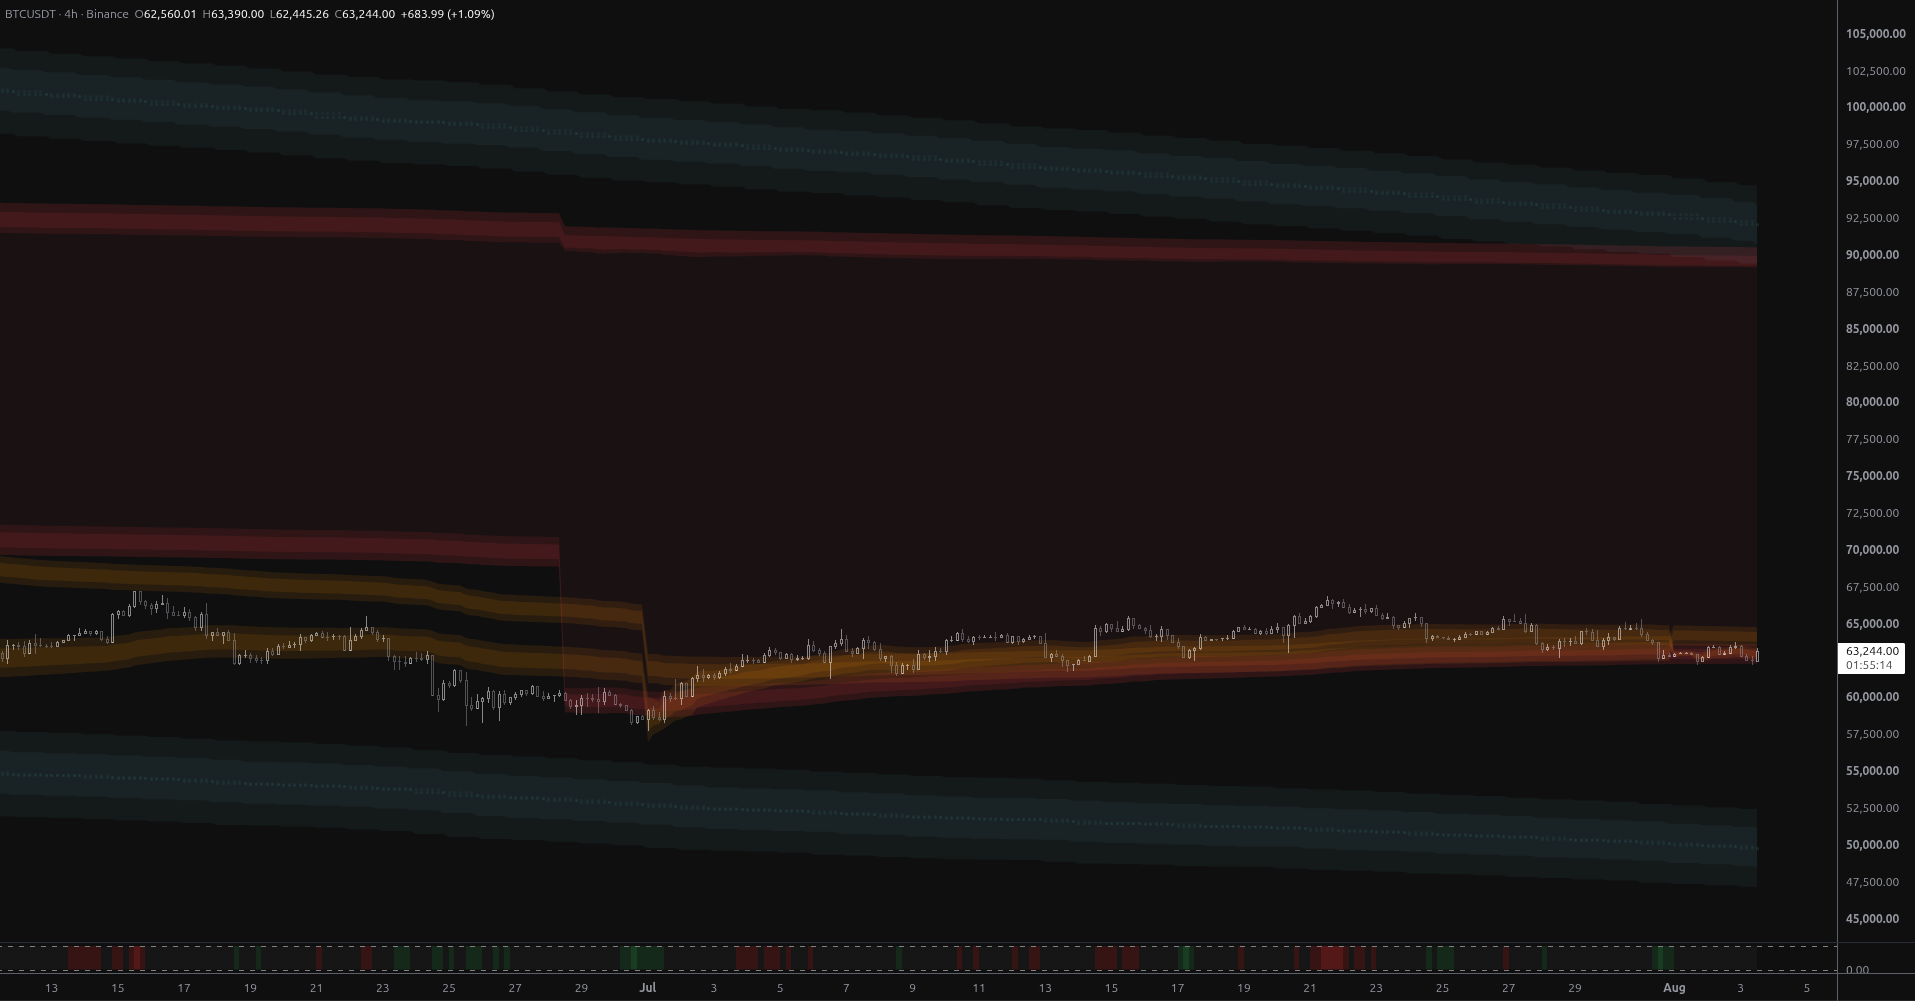
Bitcoin: Exhaustion at the Envelope Floor
BTCUSDT has rolled over from a rounded top and is grinding below its monthly anchored fair-value envelope. With no MSL structure within 16% either way, $62,335 is the level that decides the next phase.
Connect With Us
Join our community of traders and stay updated with our latest tools and market insights.