Supply/Demand
Zones.
Automatically identifies high-probability Supply and Demand zones using advanced volume calculations and price action pattern recognition.

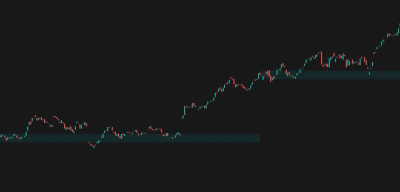
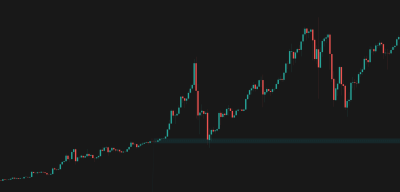
Support zone for trend continuation - AAPL, 1D
Overview
The Problem
Drawing support and resistance lines manually is subjective and often ignores where the actual trading volume occurred. Traditional pivot points don't account for market structure or volume confirmation, leading to false breakouts.
The Solution
Supply/Demand Zones automates the discovery of key institutional levels by combining volume analysis with price action patterns and volume filtering. It dynamically anchors to relevant timeframes and projects historical zones that are still relevant.
Who It's For
Price action traders, and anyone looking for objective, data-driven support and resistance zones.
Key Features
Dynamic Volume Calculation: Analyzes volume distribution to find where the most trading occurred.
Pattern Recognition: Identifies candle patterns at key points to validate zone creation.
Volume Filtering: Ensures that identified zones are backed by significant volume, filtering out weak levels.
Historical Zone Extension: Optionally extend up to 9 previous supply/demand levels to see how historical zones interact with current price.
Auto-Anchoring: Automatically adjusts the calculation period based on your current chart timeframe.
How It Works
Volume
The indicator calculates the volume traded at various price levels to identify areas where the majority of trading occurred.
Pivot & Pattern Detection
It looks for significant swing highs and lows (pivots) and checks for specific price action patterns (like engulfing candles) at these extremes to confirm a potential reversal zone.
Zone Validation
A zone is only confirmed if it passes the volume checks and, optionally, the volume filter (ensuring the move was supported by high volume).
How To Use
Quickstart
- Add Supply/Demand Zones to your chart.
- Select your preferred Theme (Dark/Light) to match your chart background.
- Adjust the 'Filtering' strength to control how many zones are displayed (Aggressive = fewer, higher quality zones).
- Enable 'Extend Previous Levels' if you want to see historical zones that price might react to.
Interpretation
- Treat the zones as areas of interest, not exact price points. Look for price action confirmation (like a pin bar or engulfing candle) when price enters a zone.
- The Midline represents the center of gravity of that zone—a highly magnetic level.
- A break and close beyond a zone often signals a continuation in that direction, turning previous supply into demand (or vice versa).
Visual Legend
| Element | Meaning | Interpretation | Common Mistake |
|---|---|---|---|
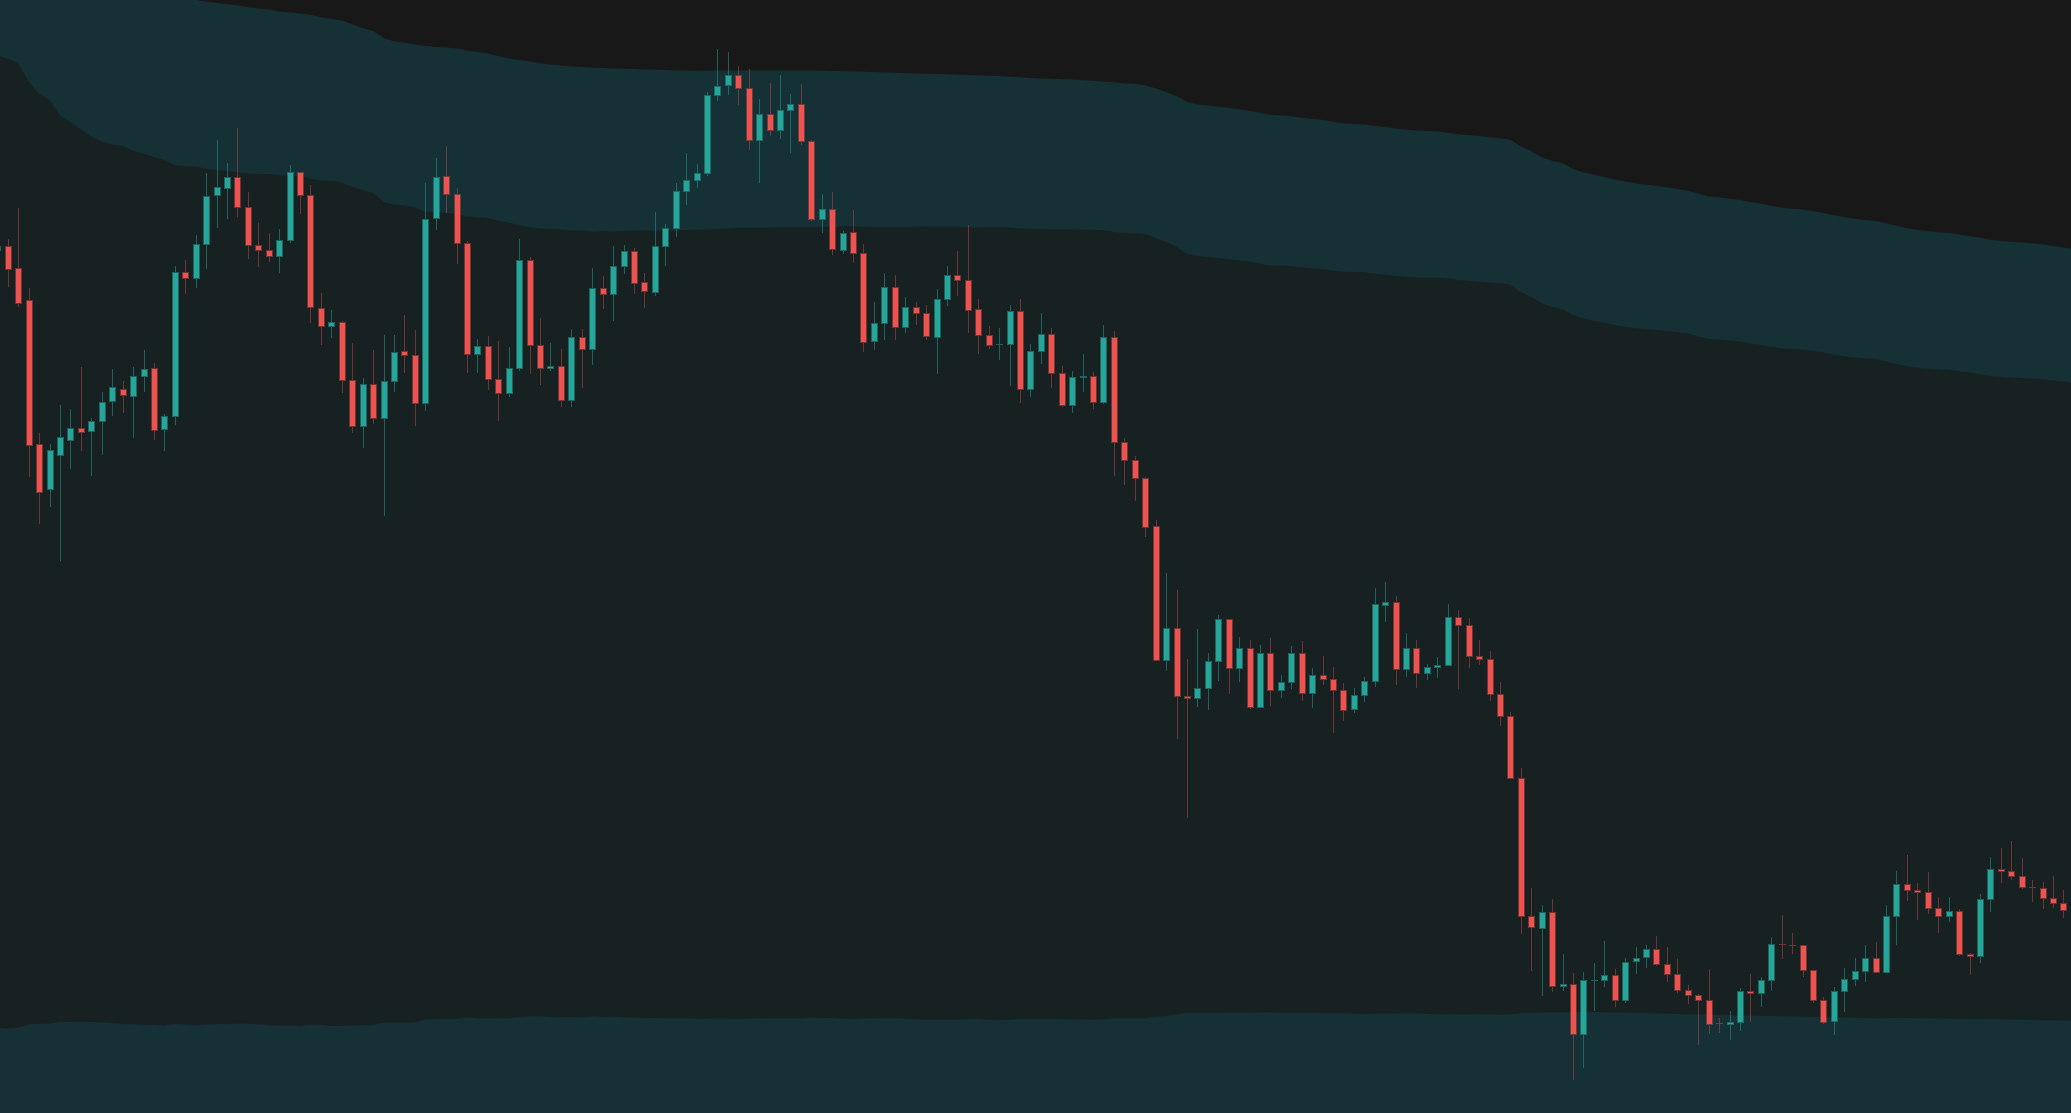
| Channel Fill | The Supply or Demand zone. | Expect price reactions or consolidation within this area. | Placing stop losses tightly inside the zone; place them outside the zone boundaries. |
| Midline | The center of gravity for the zone. | Price often gravitates towards and reacts strongly to this exact level. | Assuming it's an unbreakable wall. |
| Extended Dashed Lines | Historical Supply/Demand zones. | Watch for reactions at these levels even if they were formed in the past. | Ignoring current market context when trading off old levels. |
Settings Reference
Main
Volume
Style
Alert Types
Channel Changed
Triggered when a new Supply/Demand zone is formed.
Price Entered Channel
Triggered when price enters an active Supply/Demand zone.
Price Broke Above Channel
Triggered when price breaks and closes above the upper boundary of a zone.
Price Broke Below Channel
Triggered when price breaks and closes below the lower boundary of a zone.
Price Crossed Midline Up
Triggered when price crosses above the center line of a zone.
Price Crossed Midline Down
Triggered when price crosses below the center line of a zone.
Frequently Asked Questions
No. However, the current active zone may adjust as new price and volume data comes in during the present candle.
It works on all timeframes. The indicator automatically adjusts based on your chart's timeframe to ensure relevant zones are calculated.
Try lowering the 'Filtering' strength to 'Permissive' or 'Very Permissive', or disable the 'Use Volume Filter' option. In low volatility or low volume environments, strict settings may filter out all potential zones.
Related Indicators
Other indicators that complement Supply/Demand Zones.
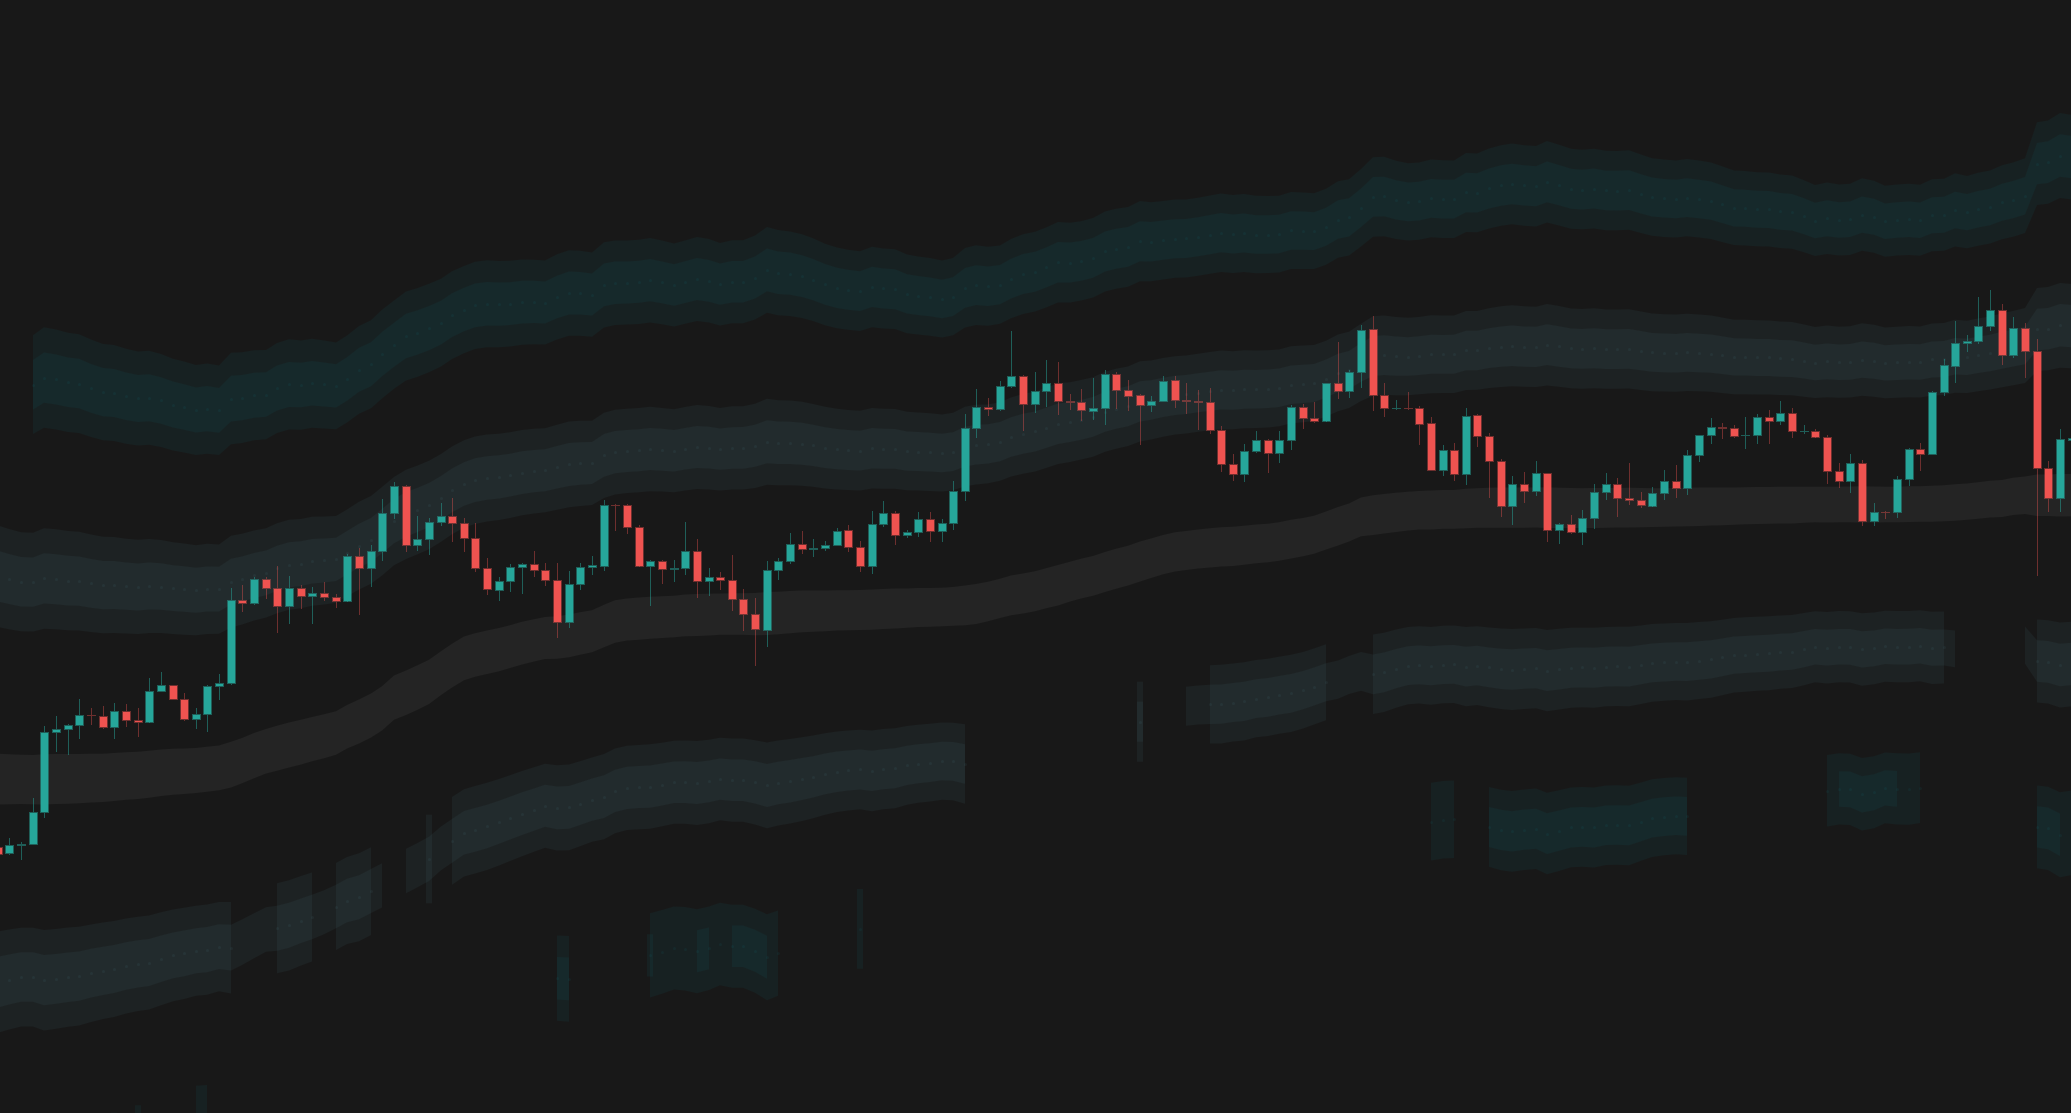
Anchored VWAP Channels
Anchored VWAP Channels that dynamically track volume-weighted average price from significant pivots or time periods, complete with volatility bands and historical levels.
Market Structure Levels
Dynamic support and resistance levels that automatically adapt to market volatility and price action, providing a structured grid for trading.
Anchored VWAP Heatmap
A powerful volume-at-price visualization tool that anchors VWAP to significant market events and displays historical volume density as a heatmap.
Connect With Us
Join our community of traders and stay updated with our latest tools and market insights.