Market Structure
Levels.
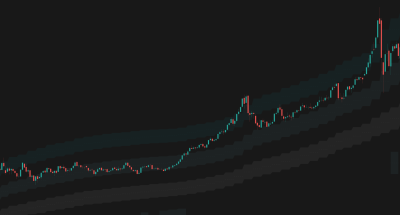
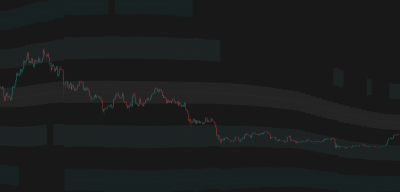
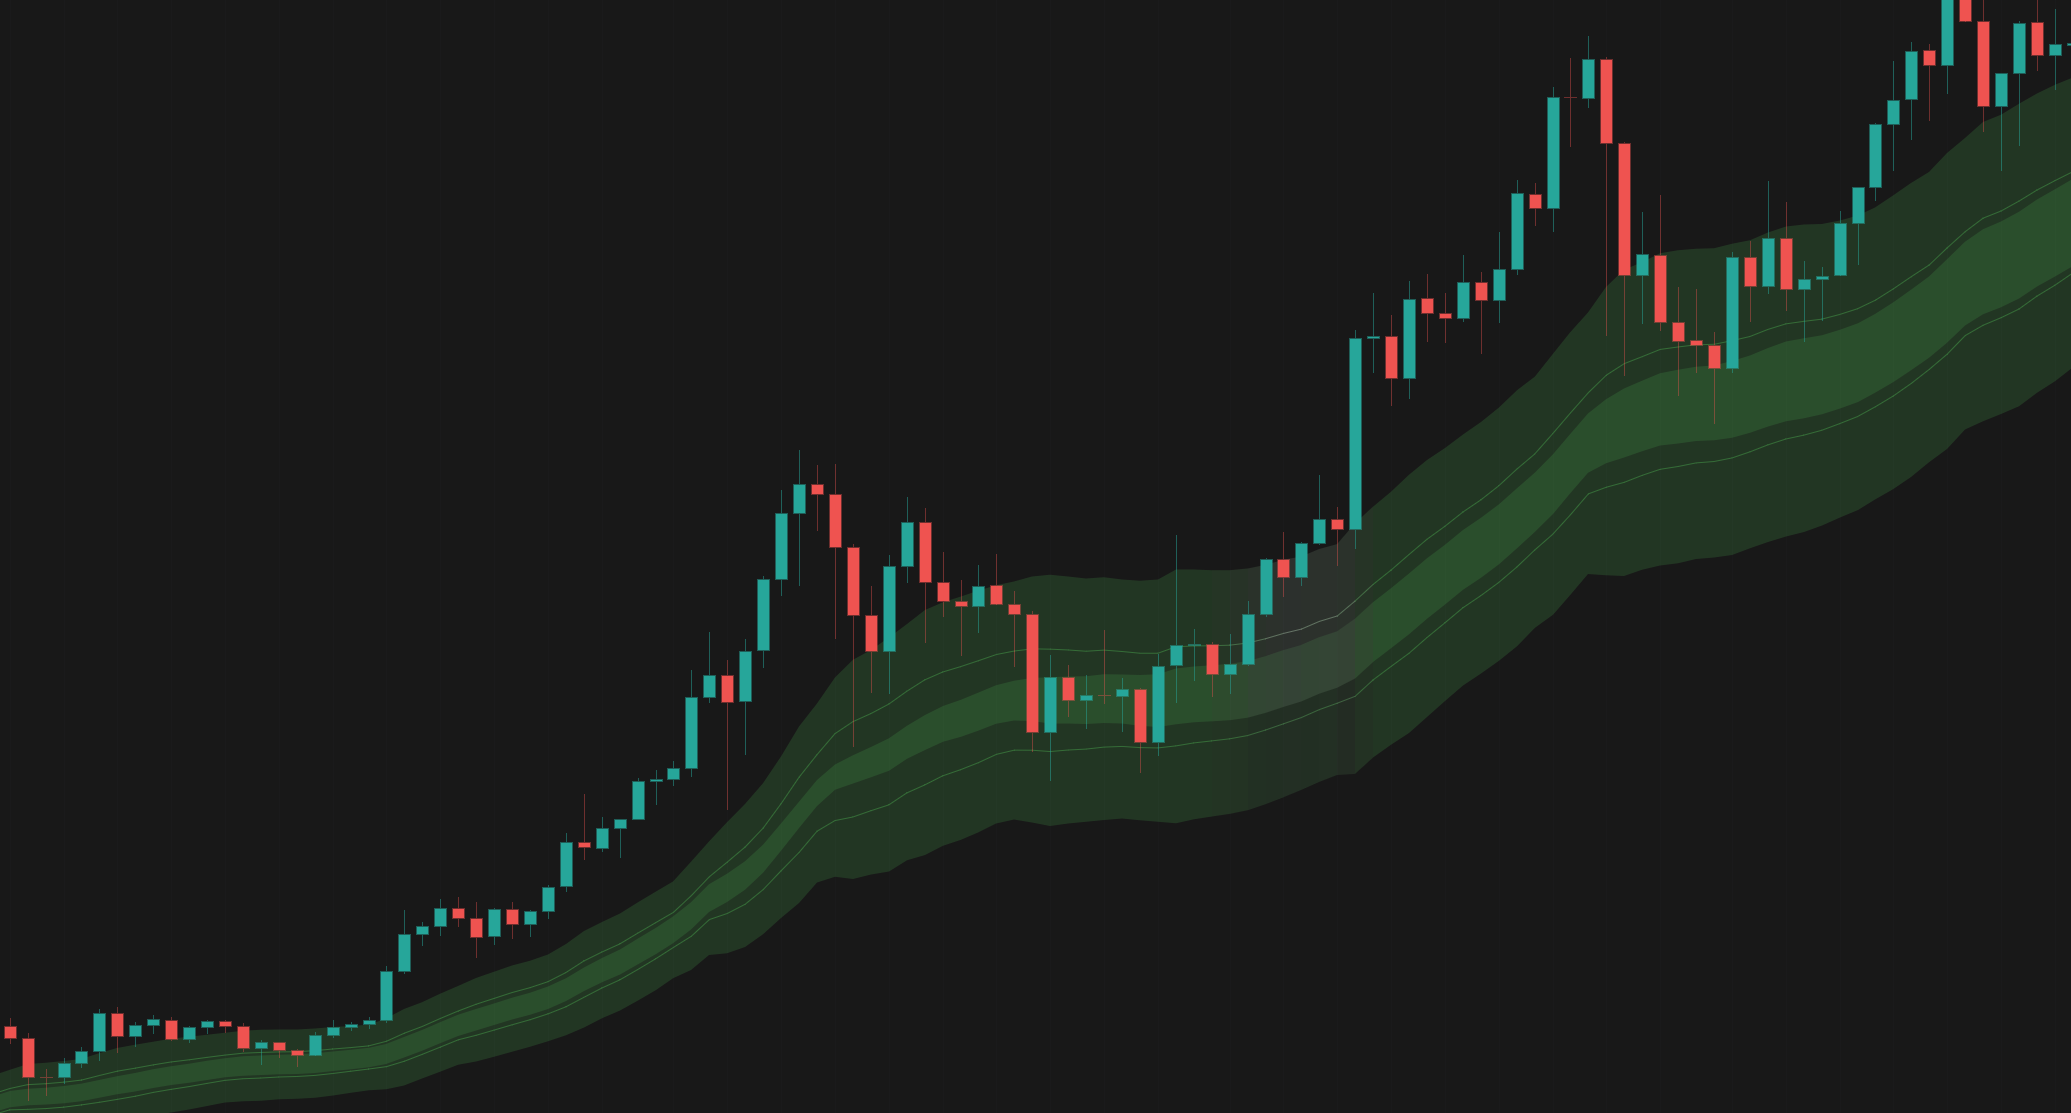
Dynamic support and resistance levels that automatically adapt to market volatility and price action, providing a structured grid for trading.

Overview
The Problem
Static support and resistance levels quickly become obsolete as market conditions change. Drawing them manually is subjective and time-consuming. Fixed-distance bands don't account for expanding or contracting volatility.
The Solution
Market Structure Levels uses an advanced algorithm to generate a dynamic grid of support and resistance zones. It automatically adjusts the distance between levels based on current volatility (ATR) and price action, ensuring the levels remain relevant in any market regime.
Who It's For
Reversal traders, range traders, and anyone needing objective, dynamic support and resistance zones.
Key Features
Dynamic Level Generation: Automatically calculates support and resistance levels based on a central moving average and ATR.
Dynamic Spacing: Intelligently adjusts the distance between levels as volatility expands or contracts.
Smart Tracking: Tracks price movement to keep the most relevant levels in focus.
Multiple MA Types: Choose from 8 different moving average algorithms (including KAMA, HMA, and EMA) for the base level.
Smart Display Strategies: 'Mild' or 'Aggressive' modes to hide irrelevant far-side levels and keep your chart clean.
How It Works
Base Level Calculation
The indicator starts by calculating a central baseline using your chosen Moving Average type and length. This acts as the 'fair value' or center of gravity for the market.
Volatility-Based Spacing
It uses the Average True Range (ATR) to determine the initial distance between levels. This ensures the grid expands during high volatility and contracts during low volatility.
Dynamic Adjustment
The indicator continuously monitors price action. If price moves too far or too fast, it recalculates the step size to ensure the levels remain relevant and properly spaced.
How To Use
Quickstart
- Add Market Structure Levels to your chart.
- Select your preferred MA Type and Length for the base level.
- Adjust the 'Band Height Factor' to set the width of each individual level zone.
- Use the 'Levels Distance Factor' to control how far apart the different levels are from each other.
- Choose a Display Strategy ('Mild' or 'Aggressive') to keep your chart uncluttered.
Interpretation
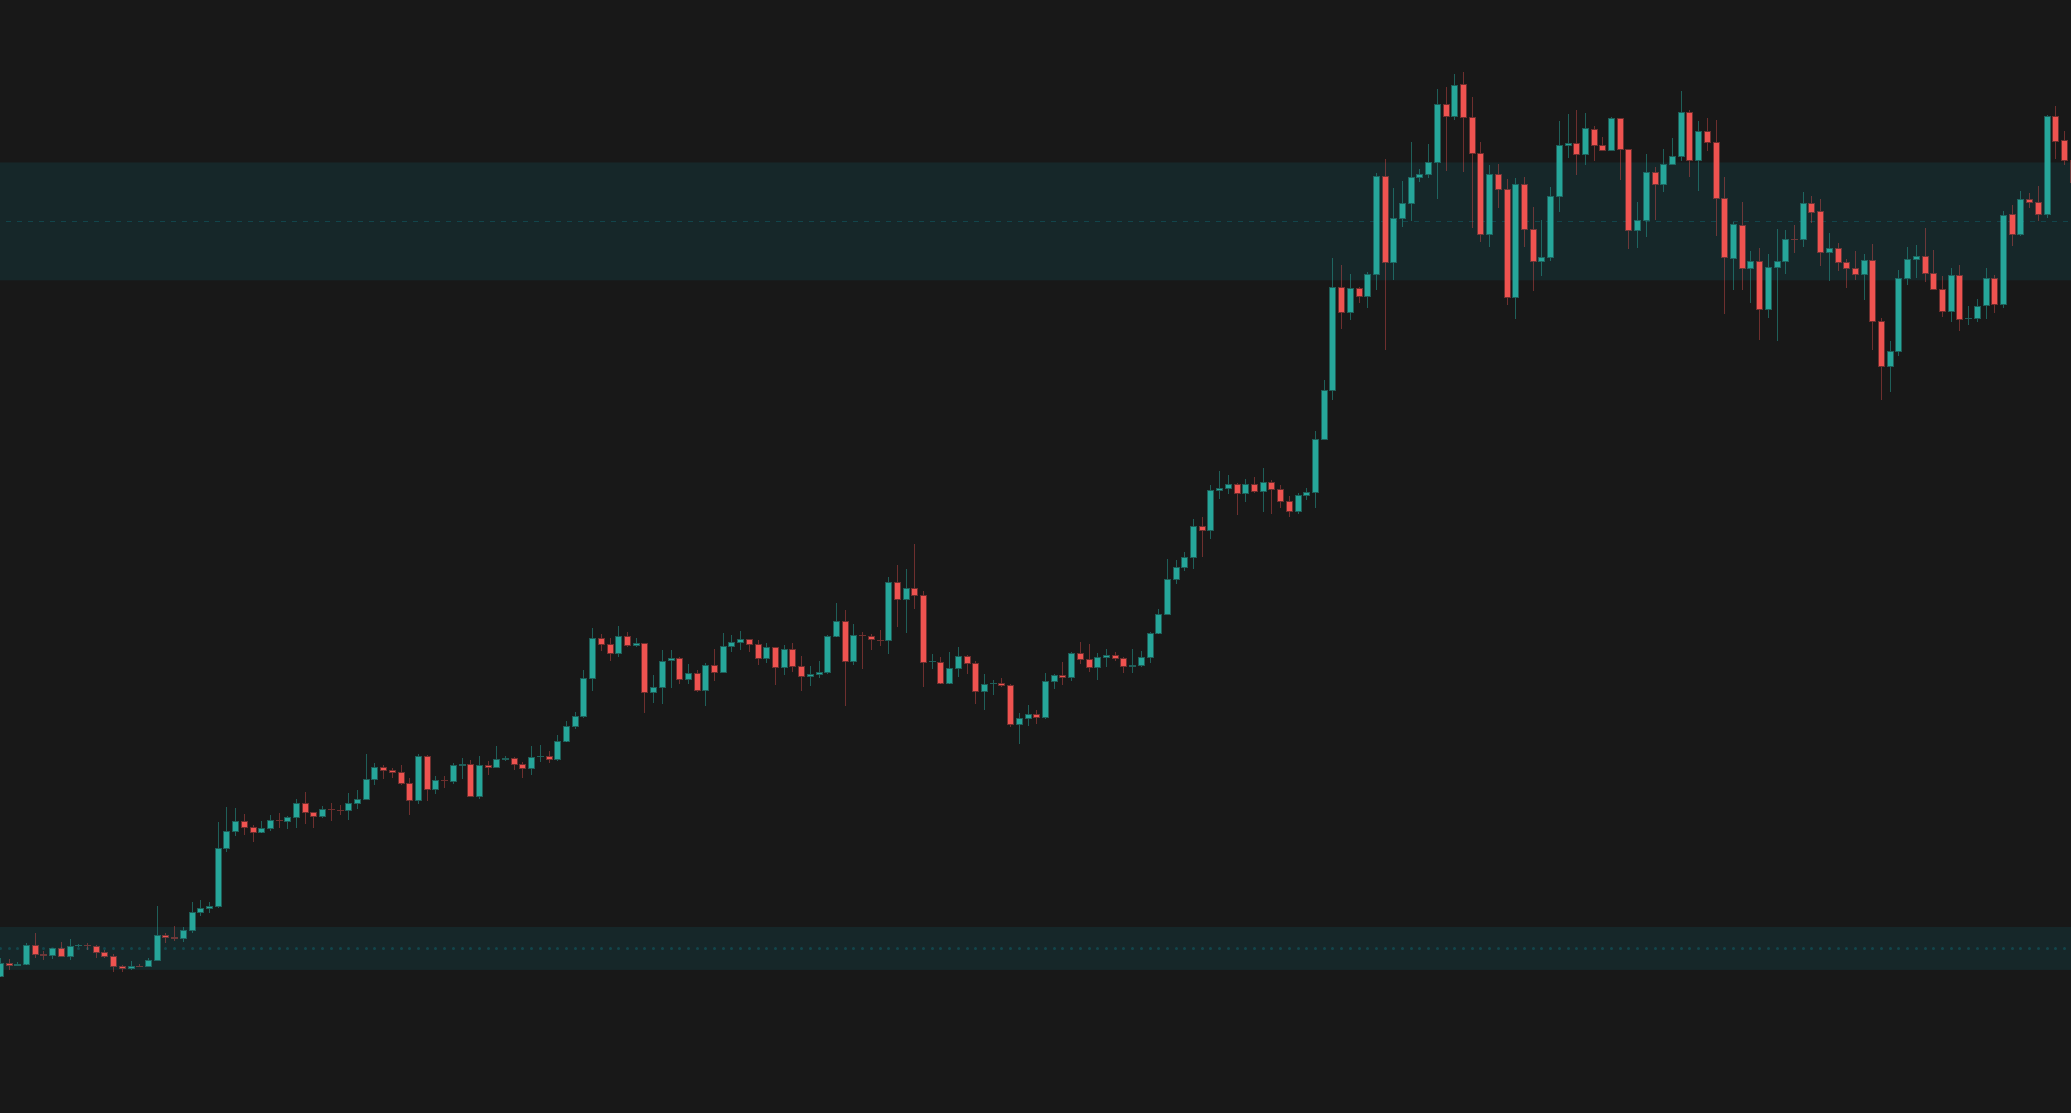
- Base Level: Acts as the primary trend filter. Price above is generally bullish, below is bearish.
- Inner Levels (1-2): Often act as first targets or minor support/resistance in a trending market.
- Outer Levels (3-5): Represent extreme deviations from the mean. Good areas to look for mean-reversion or exhaustion setups.
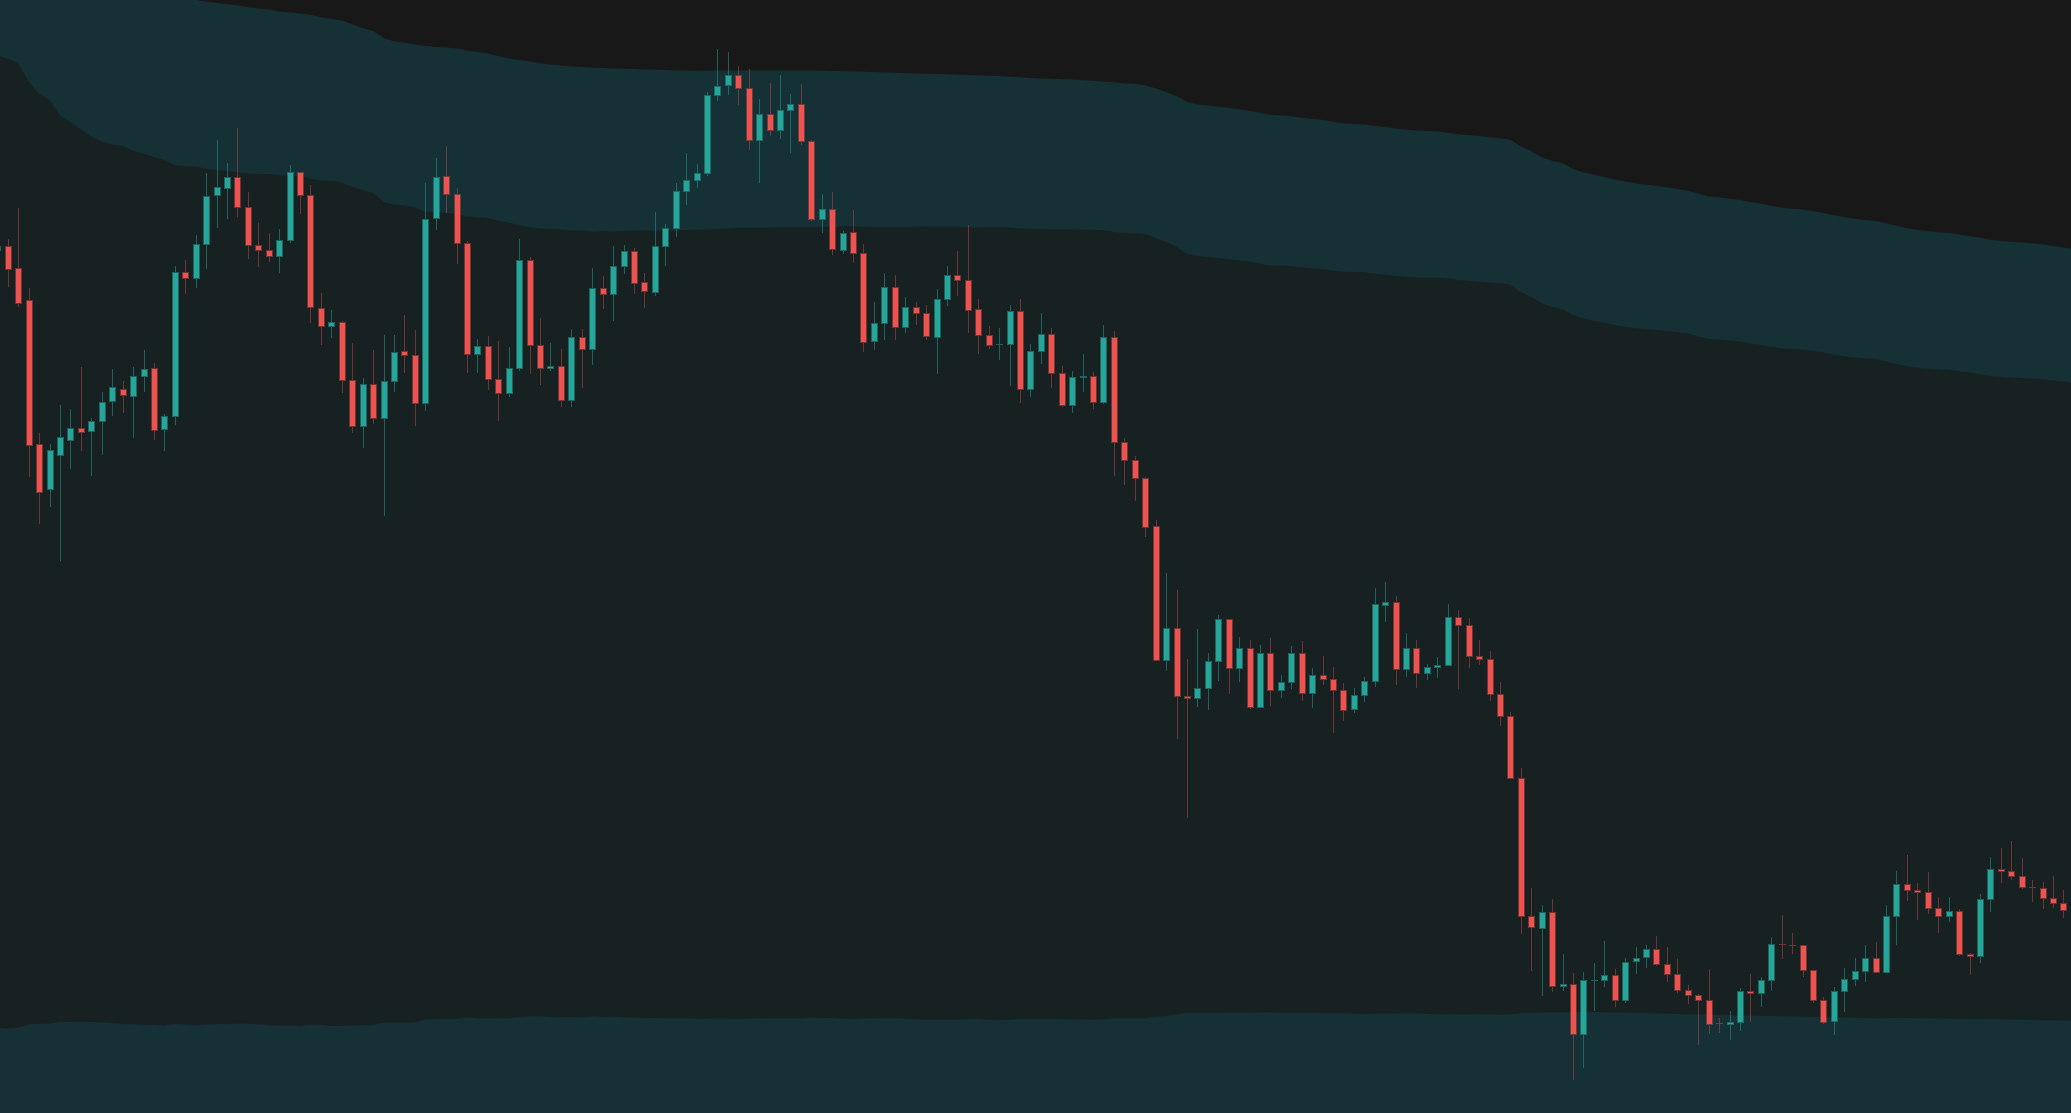
- Level Channels: The filled areas between the lines act as zones of support/resistance, rather than exact price points.
Visual Legend
| Element | Meaning | Interpretation | Common Mistake |
|---|---|---|---|
| Base Line | The central moving average. | Determines the overall market bias. | Ignoring the slope of the base line when taking trades at the outer levels. |
| Level Lines | Dynamic support and resistance boundaries. | Potential areas for price reactions or reversals. | Placing stops exactly on the lines; use the zones instead. |
| Filled Channels | Support/Resistance zones. | Areas where price is likely to consolidate or reverse. | Assuming price will always reverse at the first zone it touches. |
Settings Reference
Main
Advanced: Levels Distance
Advanced: KAMA
Advanced: Display
Style
Alert Types
Level Midline Crossed
Triggered when price crosses any of the level midlines.
Entered Level Channel
Triggered when price enters any of the level channels.
Levels Adjusted
Triggered when the indicator recalculates and adjusts the level spacing.
Crossed Above Base
Triggered when price crosses above the base moving average.
Crossed Below Base
Triggered when price crosses below the base moving average.
Frequently Asked Questions
This is the dynamic spacing at work. When volatility changes significantly or price moves outside the expected range, the indicator recalculates the optimal spacing to keep the levels relevant.
Mild gradually hides levels that are far away on the opposite side of the price action. Aggressive strictly limits visibility to only the 1 or 2 levels immediately surrounding the current price, keeping the chart very clean.
No, Market Structure Levels does not repaint historical data.
Related Indicators
Other indicators that complement Market Structure Levels.
Anchored VWAP Channels
Anchored VWAP Channels that dynamically track volume-weighted average price from significant pivots or time periods, complete with volatility bands and historical levels.
Supply/Demand Zones
Automatically identifies high-probability Supply and Demand zones using advanced volume calculations and price action pattern recognition.
Adaptive MA Bands
Advanced moving average algorithms that automatically adjust to market volatility, filtering out noise in choppy markets while capturing trends early.
Connect With Us
Join our community of traders and stay updated with our latest tools and market insights.