
SOL Coils Below Its 200-Bar Centre: Distribution
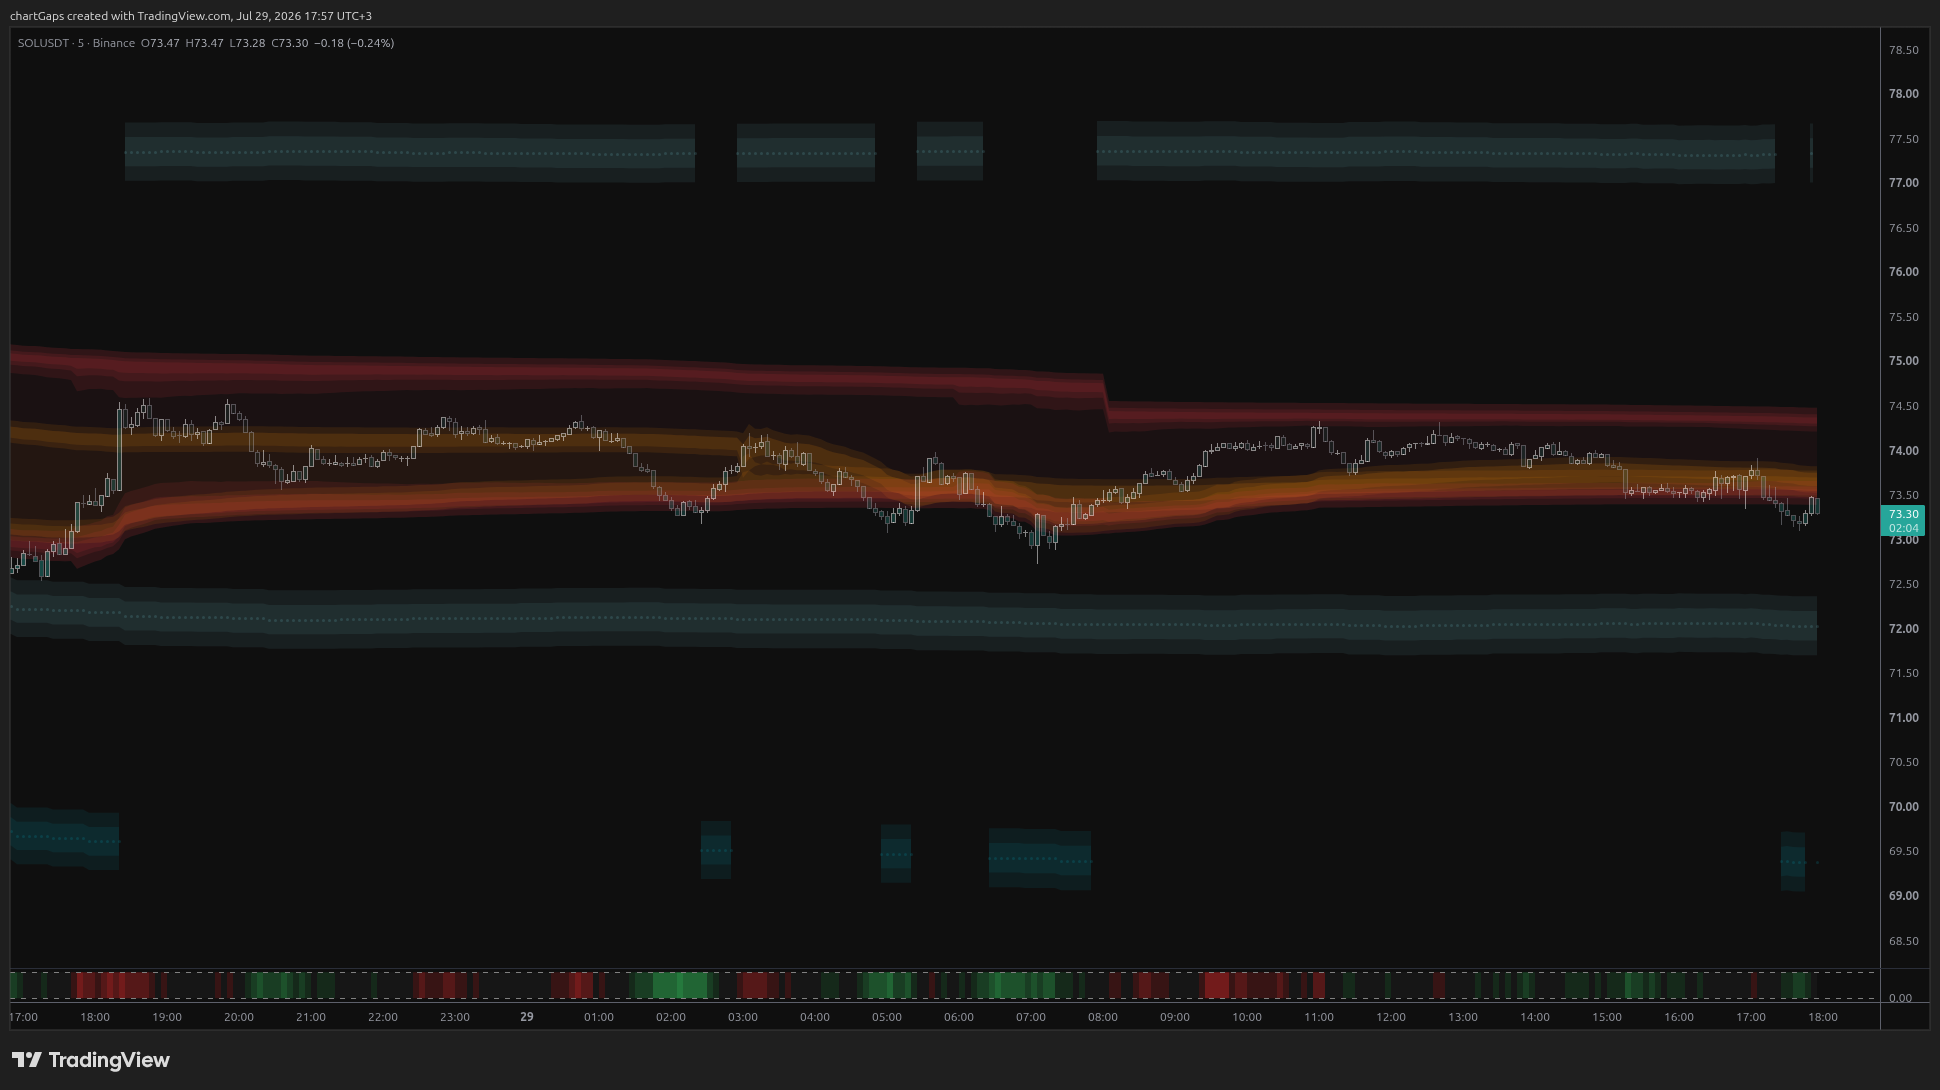
SOLUSDT sits at $73.48, floating in the MSL centre gap for 485 bars with bearish regime at 0.94 and distribution at 1.00. Bounces into $73.63-$73.84 look like supply; untested below_1 at $72.39-$71.74 is the unfinished business.
The content on this page is for educational and informational purposes only and does not constitute financial advice. We are not licensed financial advisors or professional traders. Trading involves substantial risk of loss and is not suitable for every investor. Past performance is not indicative of future results. Always do your own research and consult a qualified financial professional before making any investment decisions.
Executive Summary
SOLUSDT is trading at $73.48 on the 5-minute chart, parked in the widest structural void the MSL grid offers: the unbanded gap between below_1 ($71.74 – $72.39, mid $72.06) and above_1 ($77.01 – $77.66, mid $77.31). Price has been nearest to below_1 for 485 consecutive bars — roughly 40 hours — without ever trading down into it, and the last band change was a downward migration 485 bars ago. That single fact frames everything: the market has spent nearly two days grinding sideways in the low-$73s/mid-$74s, above the band it fell toward but unable to build a run at the band above.
The two anchored-VWAP envelopes and both hidden-Markov classifiers now agree on posture: the regime model reads bearish at 0.94 confidence after a bullish-to-bearish flip, and the structural classifier reads distribution at 1.00 confidence after rotating out of resistance cap. Price is sitting on the very lower rail of the session envelope after a 2.2x-volume flush, so the tactical picture is a bounce inside a broader distributive drift.
Trend Overview: A 15-Hour Range With Lower Highs
The 180-bar window traces a clear box rather than a trend:
- Phase 1 (open of window): drift up from $73.83 to the $74.10–$74.20 shelf, with the regime tagged strong bullish and structure at resistance cap — the first warning that the advance was happening against a ceiling, not through it.
- Phase 2 (the flush): a persistent slide to the window low of $72.73, printed on a 3.9x relative-volume bar. Structure flipped to distribution, regime to strong bearish. Both anchored envelopes had price pinned in below_bottom for a dozen bars — the deepest stretch of the session.
- Phase 3 (the reclaim): a methodical, low-drama recovery from $72.94 back to $74.33, the window high. Regime rotated to bullish and structure to breakout for roughly 20 bars — the only genuinely constructive stretch in the sample. Price held above_top of the session envelope for 25+ consecutive bars.
- Phase 4 (the fade — current): from $74.33 the tape has stair-stepped down through $74.00, $73.80 and $73.50, reaching $73.16 before the current bounce to $73.48. Regime is back to bearish, structure back to distribution.
Swing structure is officially "unclear", and the raw prints explain why: the last two swing highs are both $74.10 (a flat double top), while swing lows have stepped down from $73.79 to $73.46. Flat highs plus lower lows is the classic compression-before-resolution pattern, and in a bearish regime the base case for such compression resolves lower.
Level Structure: MSL Grid
The MSL grid is the anchor for the longer-term outlook because its bands are 1.0 x ATR(200) wide and spaced 10 ATR steps apart — these are structural, not tactical, levels.
| Band | Range | Midline | Distance from $73.48 | Role |
|---|---|---|---|---|
| above_1 | $77.01 – $77.66 | $77.31 | +4.77% | Next structural objective on any regime flip |
| below_1 | $71.74 – $72.39 | $72.06 | -1.48% to band top | Nearest band; magnet for 485 bars |
| below_2 | $69.11 – $69.77 | $69.44 | -5.05% | Downside band-to-band target if below_1 fails |
Two things stand out. First, the reported in-band position of 2.0 across essentially the entire window means price has been persistently above the below_1 band, floating in the centre gap — it has never actually entered the band it is nearest to. The logged "tests" of band_hi at $72.39 all show closes of $73.19–$73.48 with no rejection, i.e. the level has not been genuinely touched, let alone defended. below_1 is untested supply-side support, not proven support. That is a meaningful distinction: untested levels tend to be reached before they are respected.
Second, the implied SMA(200) centre near $74.69 sits above the entire 180-bar range. Price failed to reach it even at the $74.33 high. A market that spends 15 hours below its own 200-bar mean, with the regime model bearish, is structurally on the defensive regardless of how quiet the tape looks.
Anchored VWAP: Pivot Envelope
The pivot-anchored channel (117 bars since its last re-anchor — a well-established read) currently defines:
- Bottom band: $73.395 – $73.656, centred on the lowest anchored VWAP at $73.534
- Top band: $74.229 – $74.490, centred on $74.344
Price at $73.48 has just re-entered the bottom band from below_bottom (zone change this bar, direction up), with envelope position 0.078 — the extreme low of the envelope. Over the previous five bars the pivot read was below_bottom, i.e. stretched relative to every anchor the instance tracks. The reclaim of $73.395–$73.53 is the first constructive tick in a dozen bars, but it is a reclaim of the floor, not of fair value. The pivot VWAP at $73.53 is the immediate line in the sand; $73.66 is the band's upper rail and the first real supply.
Anchored VWAP: Session Envelope
The session envelope (178 bars since anchor) is the slower, contextual read:
- Bottom band: $73.486 – $73.779, centred on $73.628
- Top band: $73.549 – $73.841, centred on $73.695
Note how compressed and overlapping these are — the two session anchors have converged, which tells you the session's average participant is positioned in a tight $73.63–$73.70 pocket. Price has been below_bottom for six bars, and distance to the rail above is a mere 0.009%: $73.48 is sitting exactly on $73.486. This is the single most important tactical level on the chart right now. Sustained acceptance above it puts price back inside the session's fair-value pocket; rejection here confirms the session's participants are underwater and defending, which is precisely the mechanic that produces distribution.
Momentum and Volume
PRO reads -0.75, direction oversold, intensity 0, flat for four bars. The signal has oscillated between +1.94 and -2.90 across the window — a narrow, range-bound footprint with no impulsive rejection at either extreme. Critically, PRO's guidance is to treat oversold readings as continuation setups inside an uptrend and to ignore them during strong downtrends. With regime bearish and structure distributive, this mild oversold reading should be discounted to confluence at best: it argues for a bounce, not a reversal.
Volume tells a cleaner story. Two bars ago the tape printed 11,974 units (2.22x average) on a bearish close at $73.19 — a flush. The bounce that followed came on 1.14x and now 1.08x relative volume. That asymmetry (heavy on the down bar, ordinary on the recovery) is characteristic of a liquidity-driven bounce rather than accumulation. Compare with the Phase 3 recovery earlier in the window, which was accompanied by repeated 2.0x–2.5x bars — that had genuine sponsorship; this does not, yet.
Regime and Structural Context
The regime classifier has been unusually restless in this window, cycling strong bullish → bearish → strong bearish → bullish → mild bearish → bearish. Two readings are worth extracting:
- The bullish/breakout stretch during Phase 3 coincided exactly with price holding above the session envelope top. When price lost that shelf, the regime decayed to mild bearish then bearish within a dozen bars. Regime here is following envelope position, which makes the session lower rail at $73.486 an effective regime tripwire.
- Current confidence of 0.94 is well above the 0.4 threshold, so the bearish label carries full weight. Per the operating rules, new longs are the disfavoured side.
The structural classifier's distribution at 1.00 is the more damning read. Distribution means a compressed upper range with bearish pressure — and that is a precise description of a market that made two identical $74.10 swing highs, could not reach its 200-bar mean at $74.69, and is now making lower lows. The rotation path resistance cap → distribution is the textbook sequence for a topping range: first price caps at the top of a band, then it compresses there with sellers in control. Both prior instances of distribution in this window preceded declines of $0.30–$0.60.
Scenarios, Ordered by Likelihood
1. Most Likely — Bounce Into Supply, Then Range Continuation Lower
Price reclaims the pivot bottom band and pushes into the session fair-value pocket at $73.63–$73.70, possibly extending to the session top-band rail at $73.78–$73.84. That zone is where sellers have repeatedly re-engaged over the last 40 bars. Failure there resumes the stair-step, retesting $73.16 and then the Phase-2 shelf at $72.94–$72.73. This keeps price in the MSL centre gap, still nearest below_1, with the 485-bar clock continuing to run. Why most likely: bearish regime at 0.94, distribution at 1.00, lower swing lows, ordinary volume on the bounce, and price rejected from below its own 200-bar mean.
2. Second Most Likely — Downward Band Migration Into below_1
A decisive loss of $72.73 (the window low) opens the first genuine visit to the below_1 band in 485 bars: upper edge $72.39, midline $72.06, lower edge $71.74. This would register as an MSL band change to the downside and would be the structurally significant event of the session — the resolution of a two-day compression. Expect the band's upper edge at $72.39 to be defended on first touch (bands are 1 ATR(200) wide and act as absorption zones), so the realistic first objective is $72.39–$72.06. Invalidation: a close back above $73.78 with elevated volume before $72.73 is lost.
3. Third — Recovery Through the 200-Bar Mean
Bulls reclaim $73.84, then grind through the pivot top band at $74.23–$74.49 and the window high at $74.33, finally taking out the implied SMA(200) centre near $74.69. That sequence would require the structural state to rotate out of distribution (toward breakout) and the regime to flip back at conviction. Only above $74.69 does the above_1 band at $77.01–$77.66 become a live target — a 4.8% move that is not a same-session proposition on a 5-minute chart. Why less likely: two identical failures at $74.10, a failed prior breakout state, and no volume expansion supporting the current bid.
4. Least Likely — Cascade to below_2
If $71.74 (below_1 lower edge) gives way, the grid's next station is below_2 at $69.11–$69.77, some 5% lower. Band-to-band movement is the intended read of the MSL grid, so this is a legitimate structural path — but it requires two sequential failures ($72.73, then the full below_1 band) and would most likely need a macro or liquidation catalyst rather than the current orderly drift. Treat it as the tail scenario that defines how much room exists beneath, not as a forecast.
Key Levels Summary
| Level | Source | Significance |
|---|---|---|
| $77.31 | MSL above_1 mid | Structural upside objective (+4.77%) |
| $74.69 | Implied SMA(200) centre | Trend divider; unvisited in 180 bars |
| $74.23 – $74.49 | avwap@pivot top band | Major overhead supply |
| $74.10 / $74.33 | Double swing high / window high | Proven rejection shelf |
| $73.78 – $73.84 | avwap@anchor upper rails | Bounce-cap; bull/bear line for the session |
| $73.63 – $73.70 | avwap@anchor VWAP pair | Session fair value; first supply on the bounce |
| $73.486 | avwap@anchor lower rail | Immediate pivot — price is on it now |
| $73.53 / $73.40 | avwap@pivot VWAP / lower rail | Tactical floor; loss re-enters below_bottom |
| $73.16 | Recent low, 2.22x volume flush | First downside confirmation |
| $72.94 / $72.73 | Phase-2 shelf / window low | Gateway to below_1 |
| $72.39 / $72.06 / $71.74 | MSL below_1 band | Untested structural support |
| $69.44 | MSL below_2 mid | Tail-risk objective (-5.05%) |
What Would Change the Read
- Bullish invalidation of the bear case: two or more consecutive closes above $73.84 with relative volume above 1.5x, accompanied by the structural state leaving distribution. That would put the pivot top band at $74.23–$74.49 in play.
- Bearish confirmation: rejection at $73.63–$73.78 followed by a close below $73.16, and especially a close below $72.73 which triggers the first MSL band migration in 485 bars.
- Watch the envelope zone counters: the pivot instance just flipped from below_bottom to in_bottom. If that reverts within a handful of bars while the session read stays below_bottom, the bounce has failed and scenario 2 accelerates.
- Watch for a pivot re-anchor: the avwap@pivot instance re-anchors on every detected swing pivot. A fresh anchor would reset the envelope and signal that structure itself has changed — do not read slope across that bar.
Closing Perspective
This is not a trend market; it is a two-day distribution shelf beneath a 200-bar mean, with a nearby untested support band and a distant, uninvolved resistance band. The educational takeaway is in the disagreement between the fast and slow reads: PRO says oversold, the flush volume says capitulation, and price has just reclaimed a rail — all bounce ingredients. But the MSL grid says price never earned the right to be near above_1, the anchored VWAPs say the session's participants are trapped in a tight $73.63–$73.70 pocket above the market, and both HMMs say bearish distribution at near-maximum confidence. When a fast oscillator and slow structure disagree, the structural read usually dictates where the move ends, and the oscillator only dictates where it starts. Here, that means bounces are for selling into until $73.84 is convincingly reclaimed, and the untested below_1 band at $72.39–$71.74 remains the market's unfinished business.
This is analysis for educational purposes, not a trade signal. Levels and probabilities are structural estimates, not guarantees.
Featured Indicators
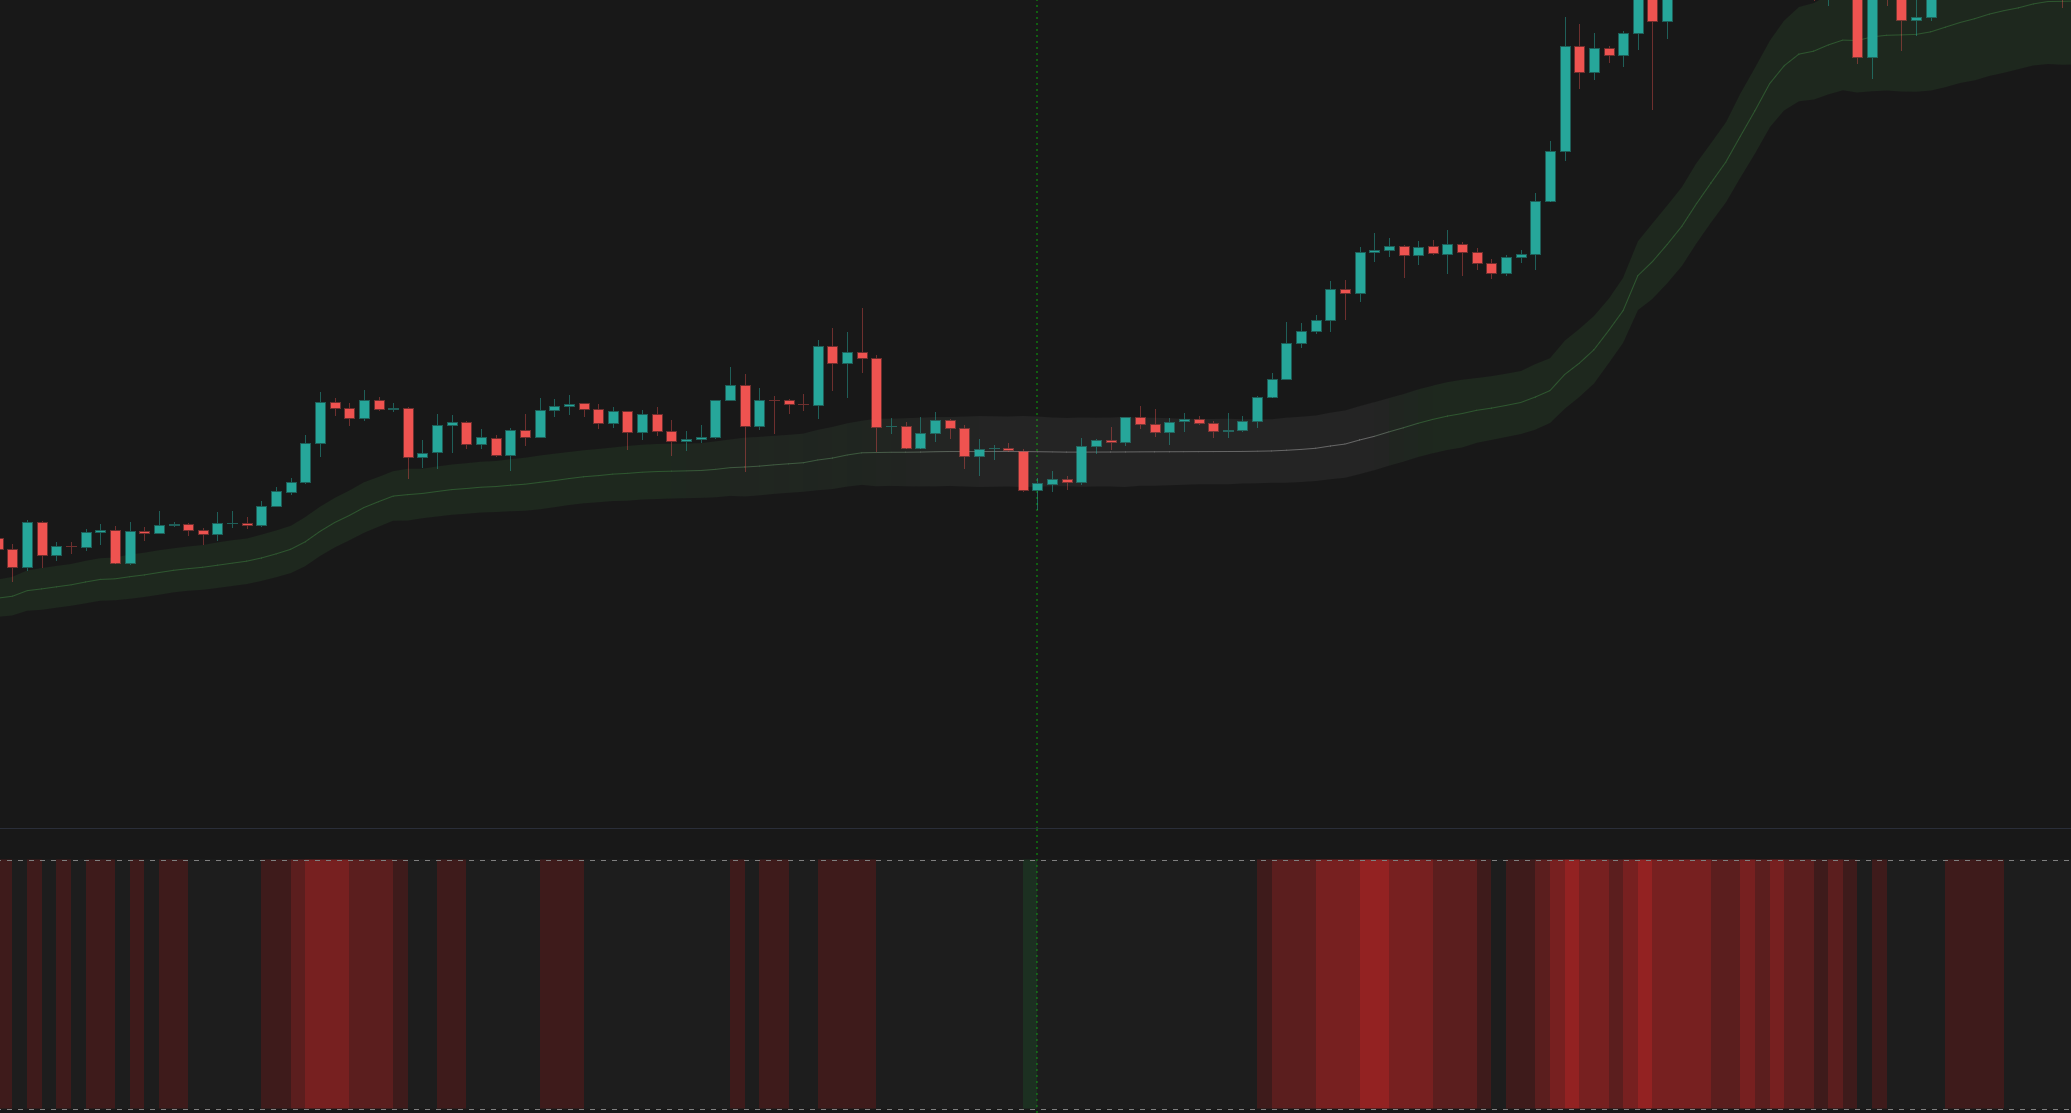
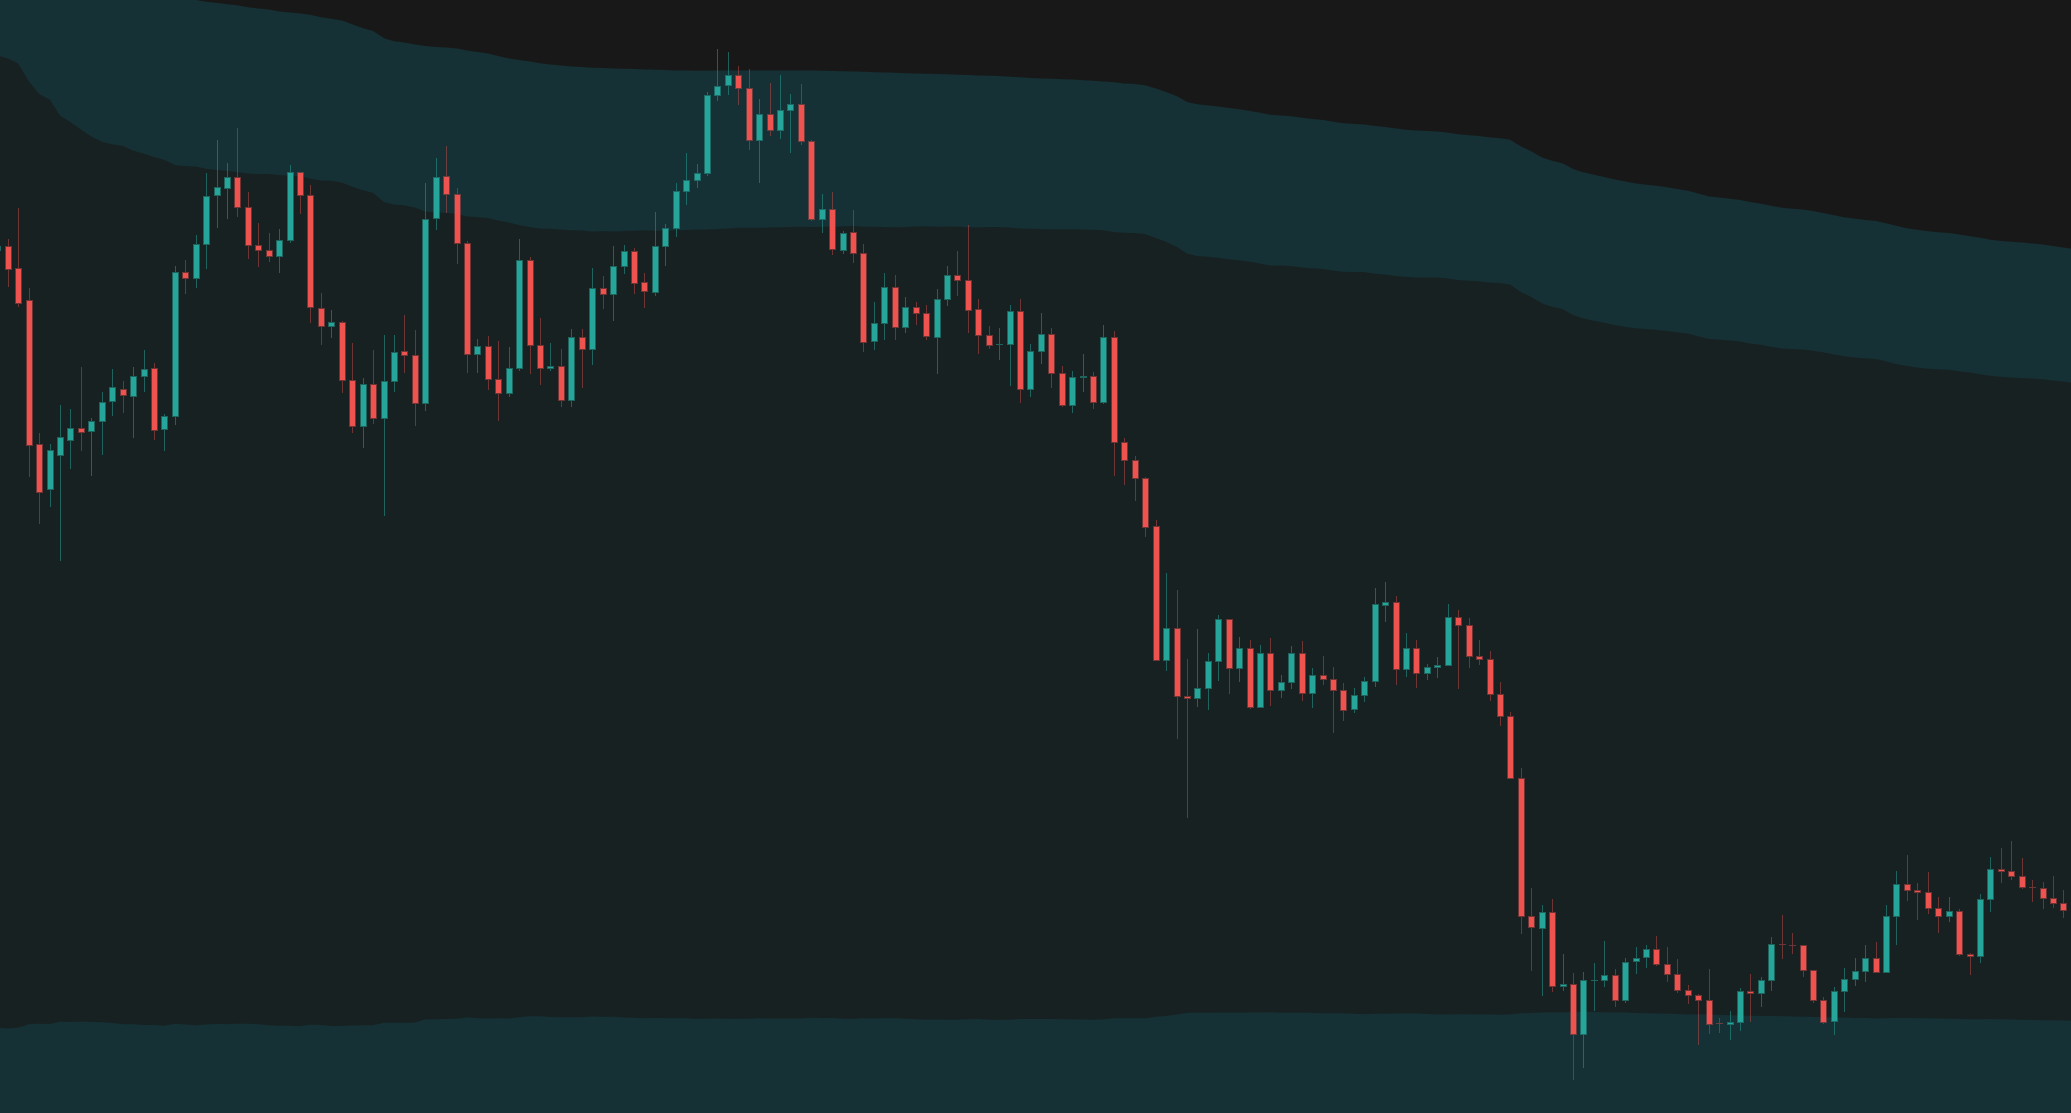
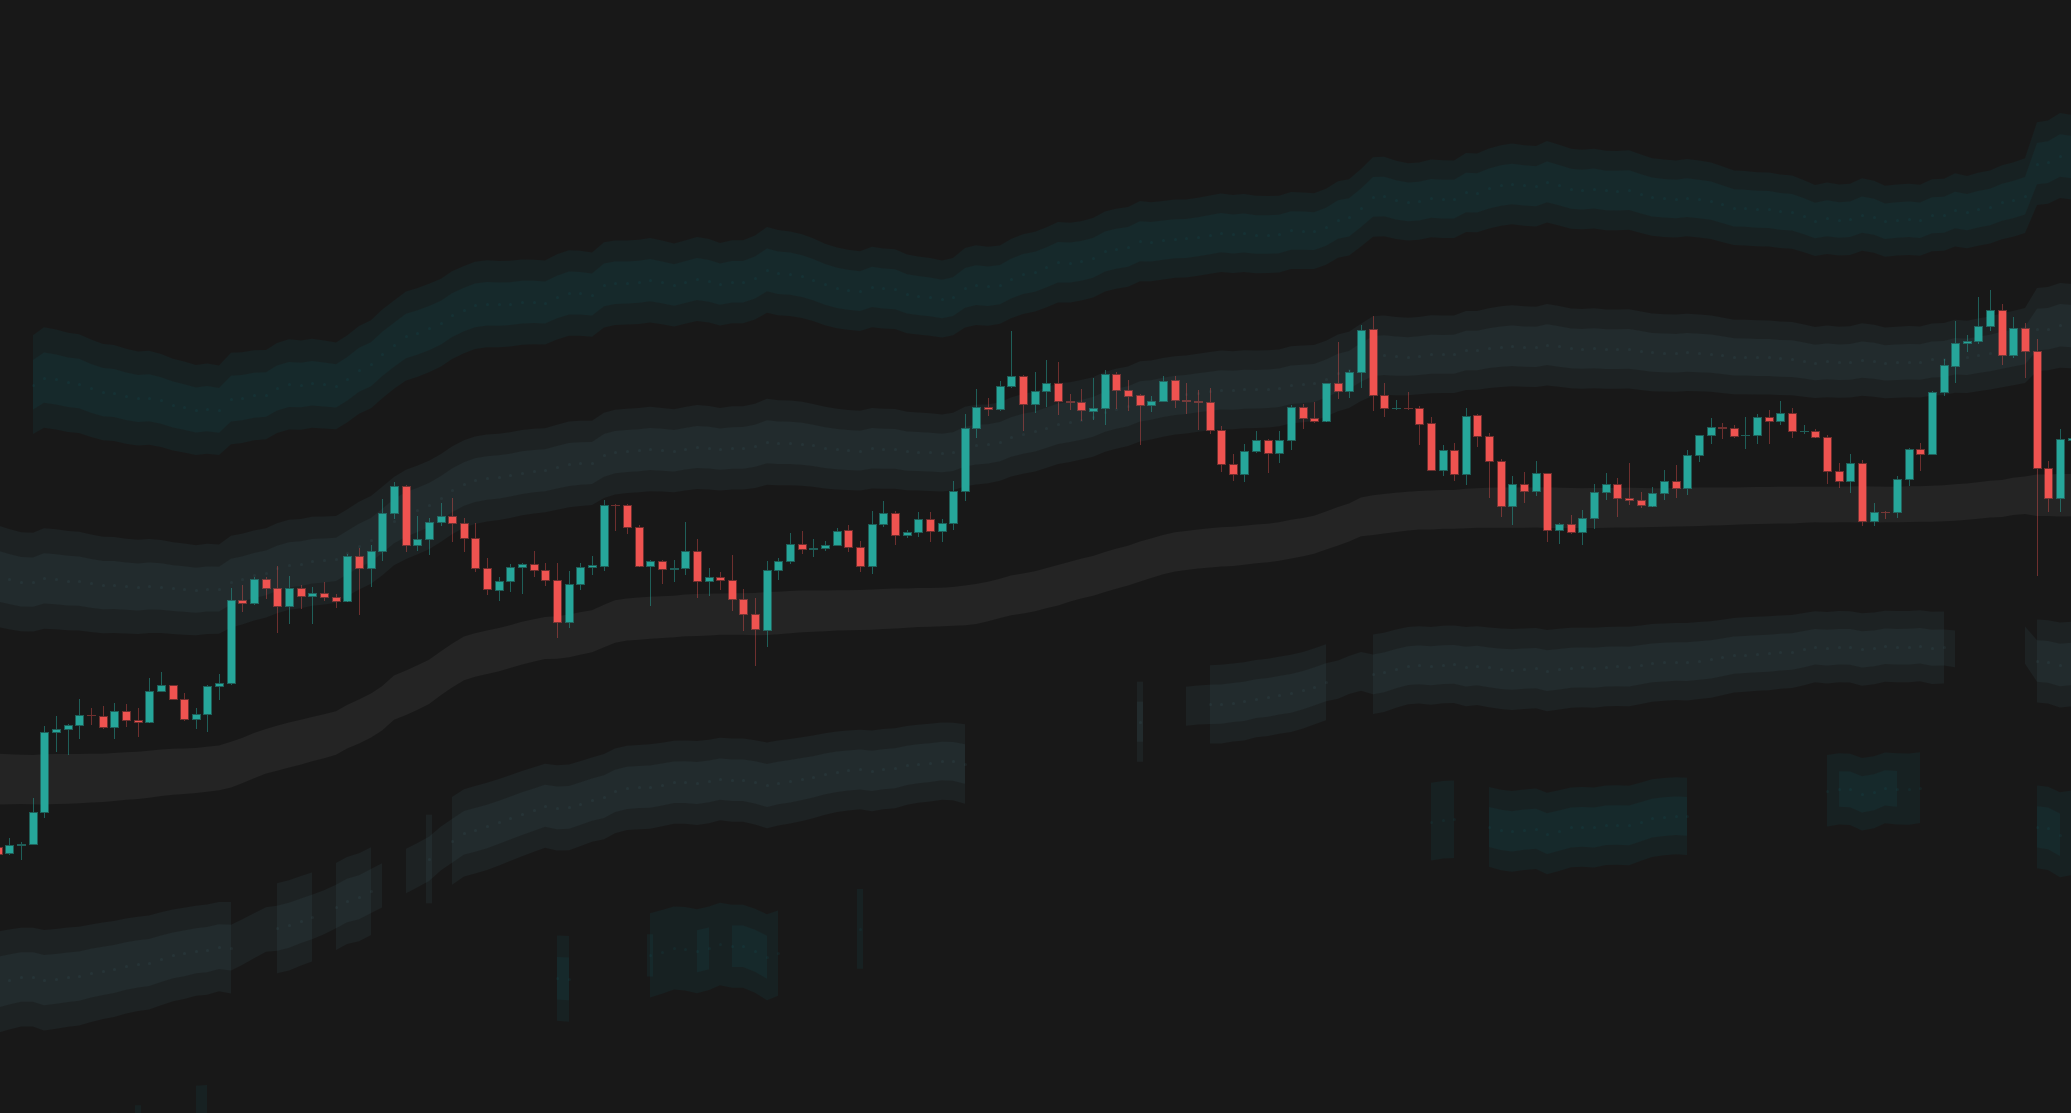
The indicators referenced in this trading idea.
Related Ideas
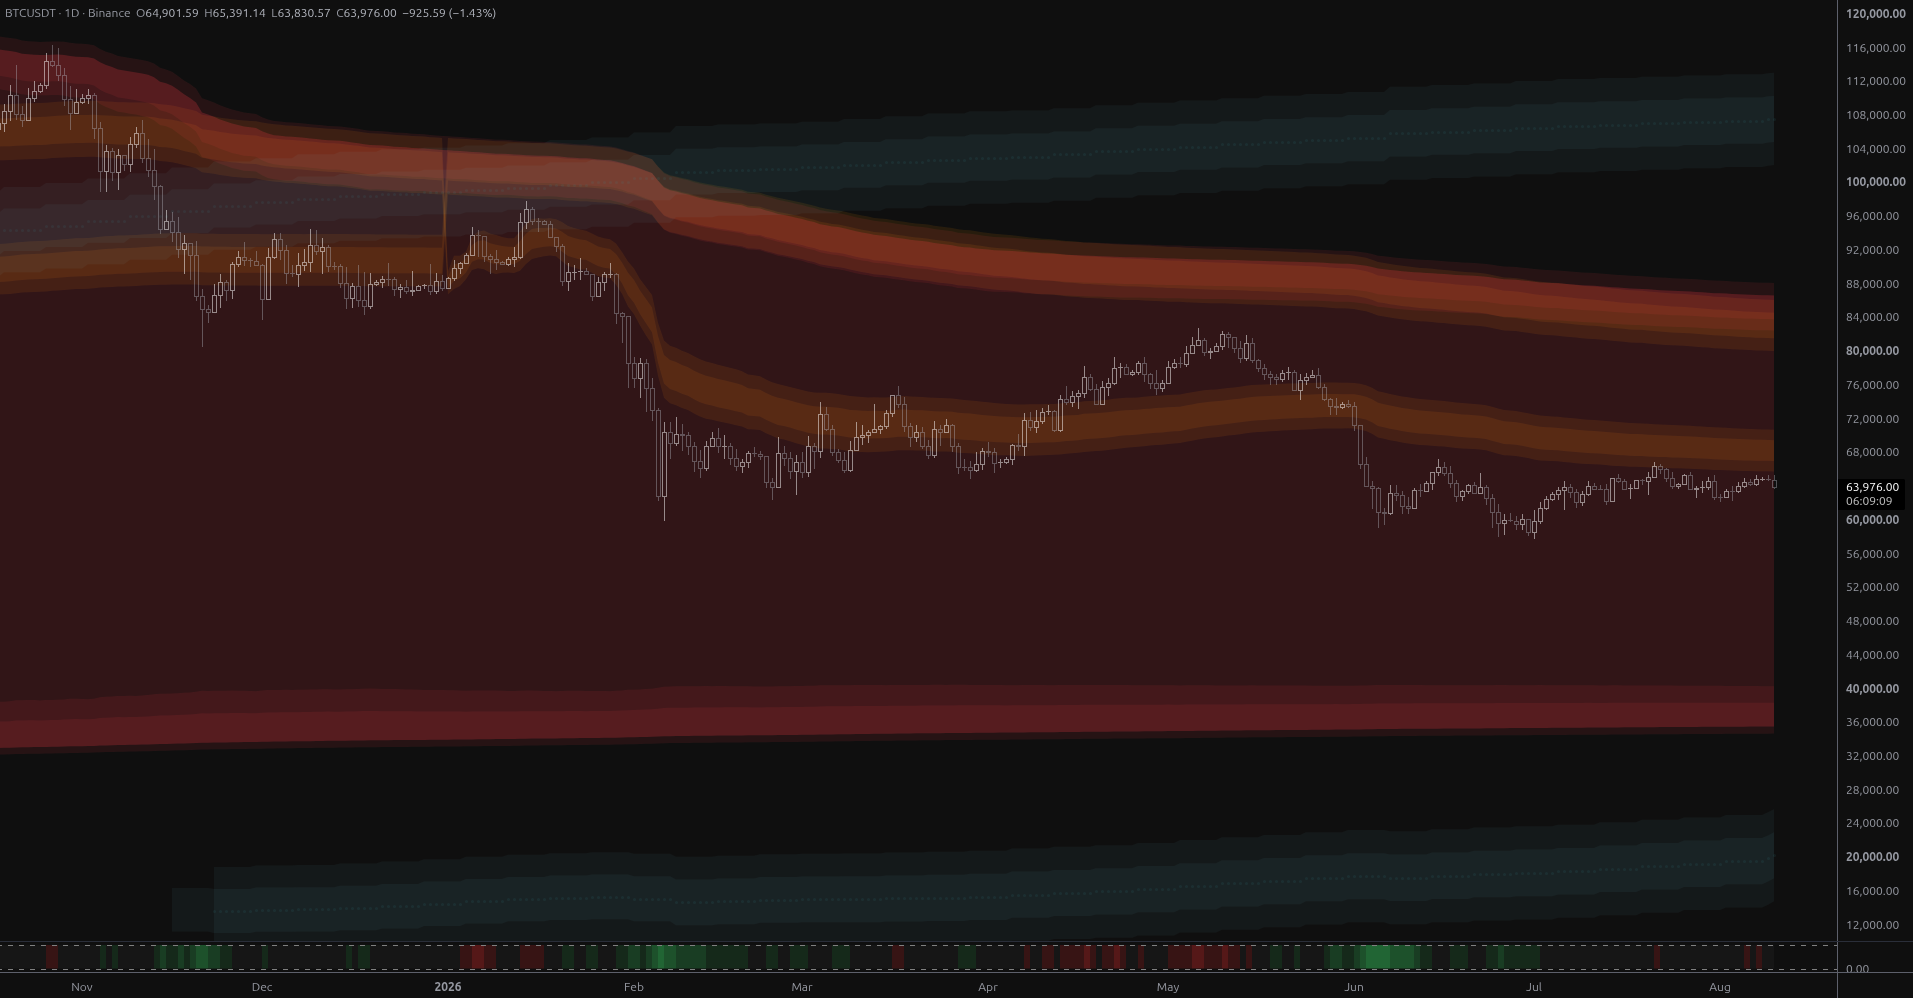
BTC Coils Just Under Its Yearly Value Rail
Bitcoin is coiling at $64,901 just 1.8% below its year-anchored value rail at $66,048, with structural bands far away in both directions. Ranked scenarios, key levels and the air pocket below $57,800.
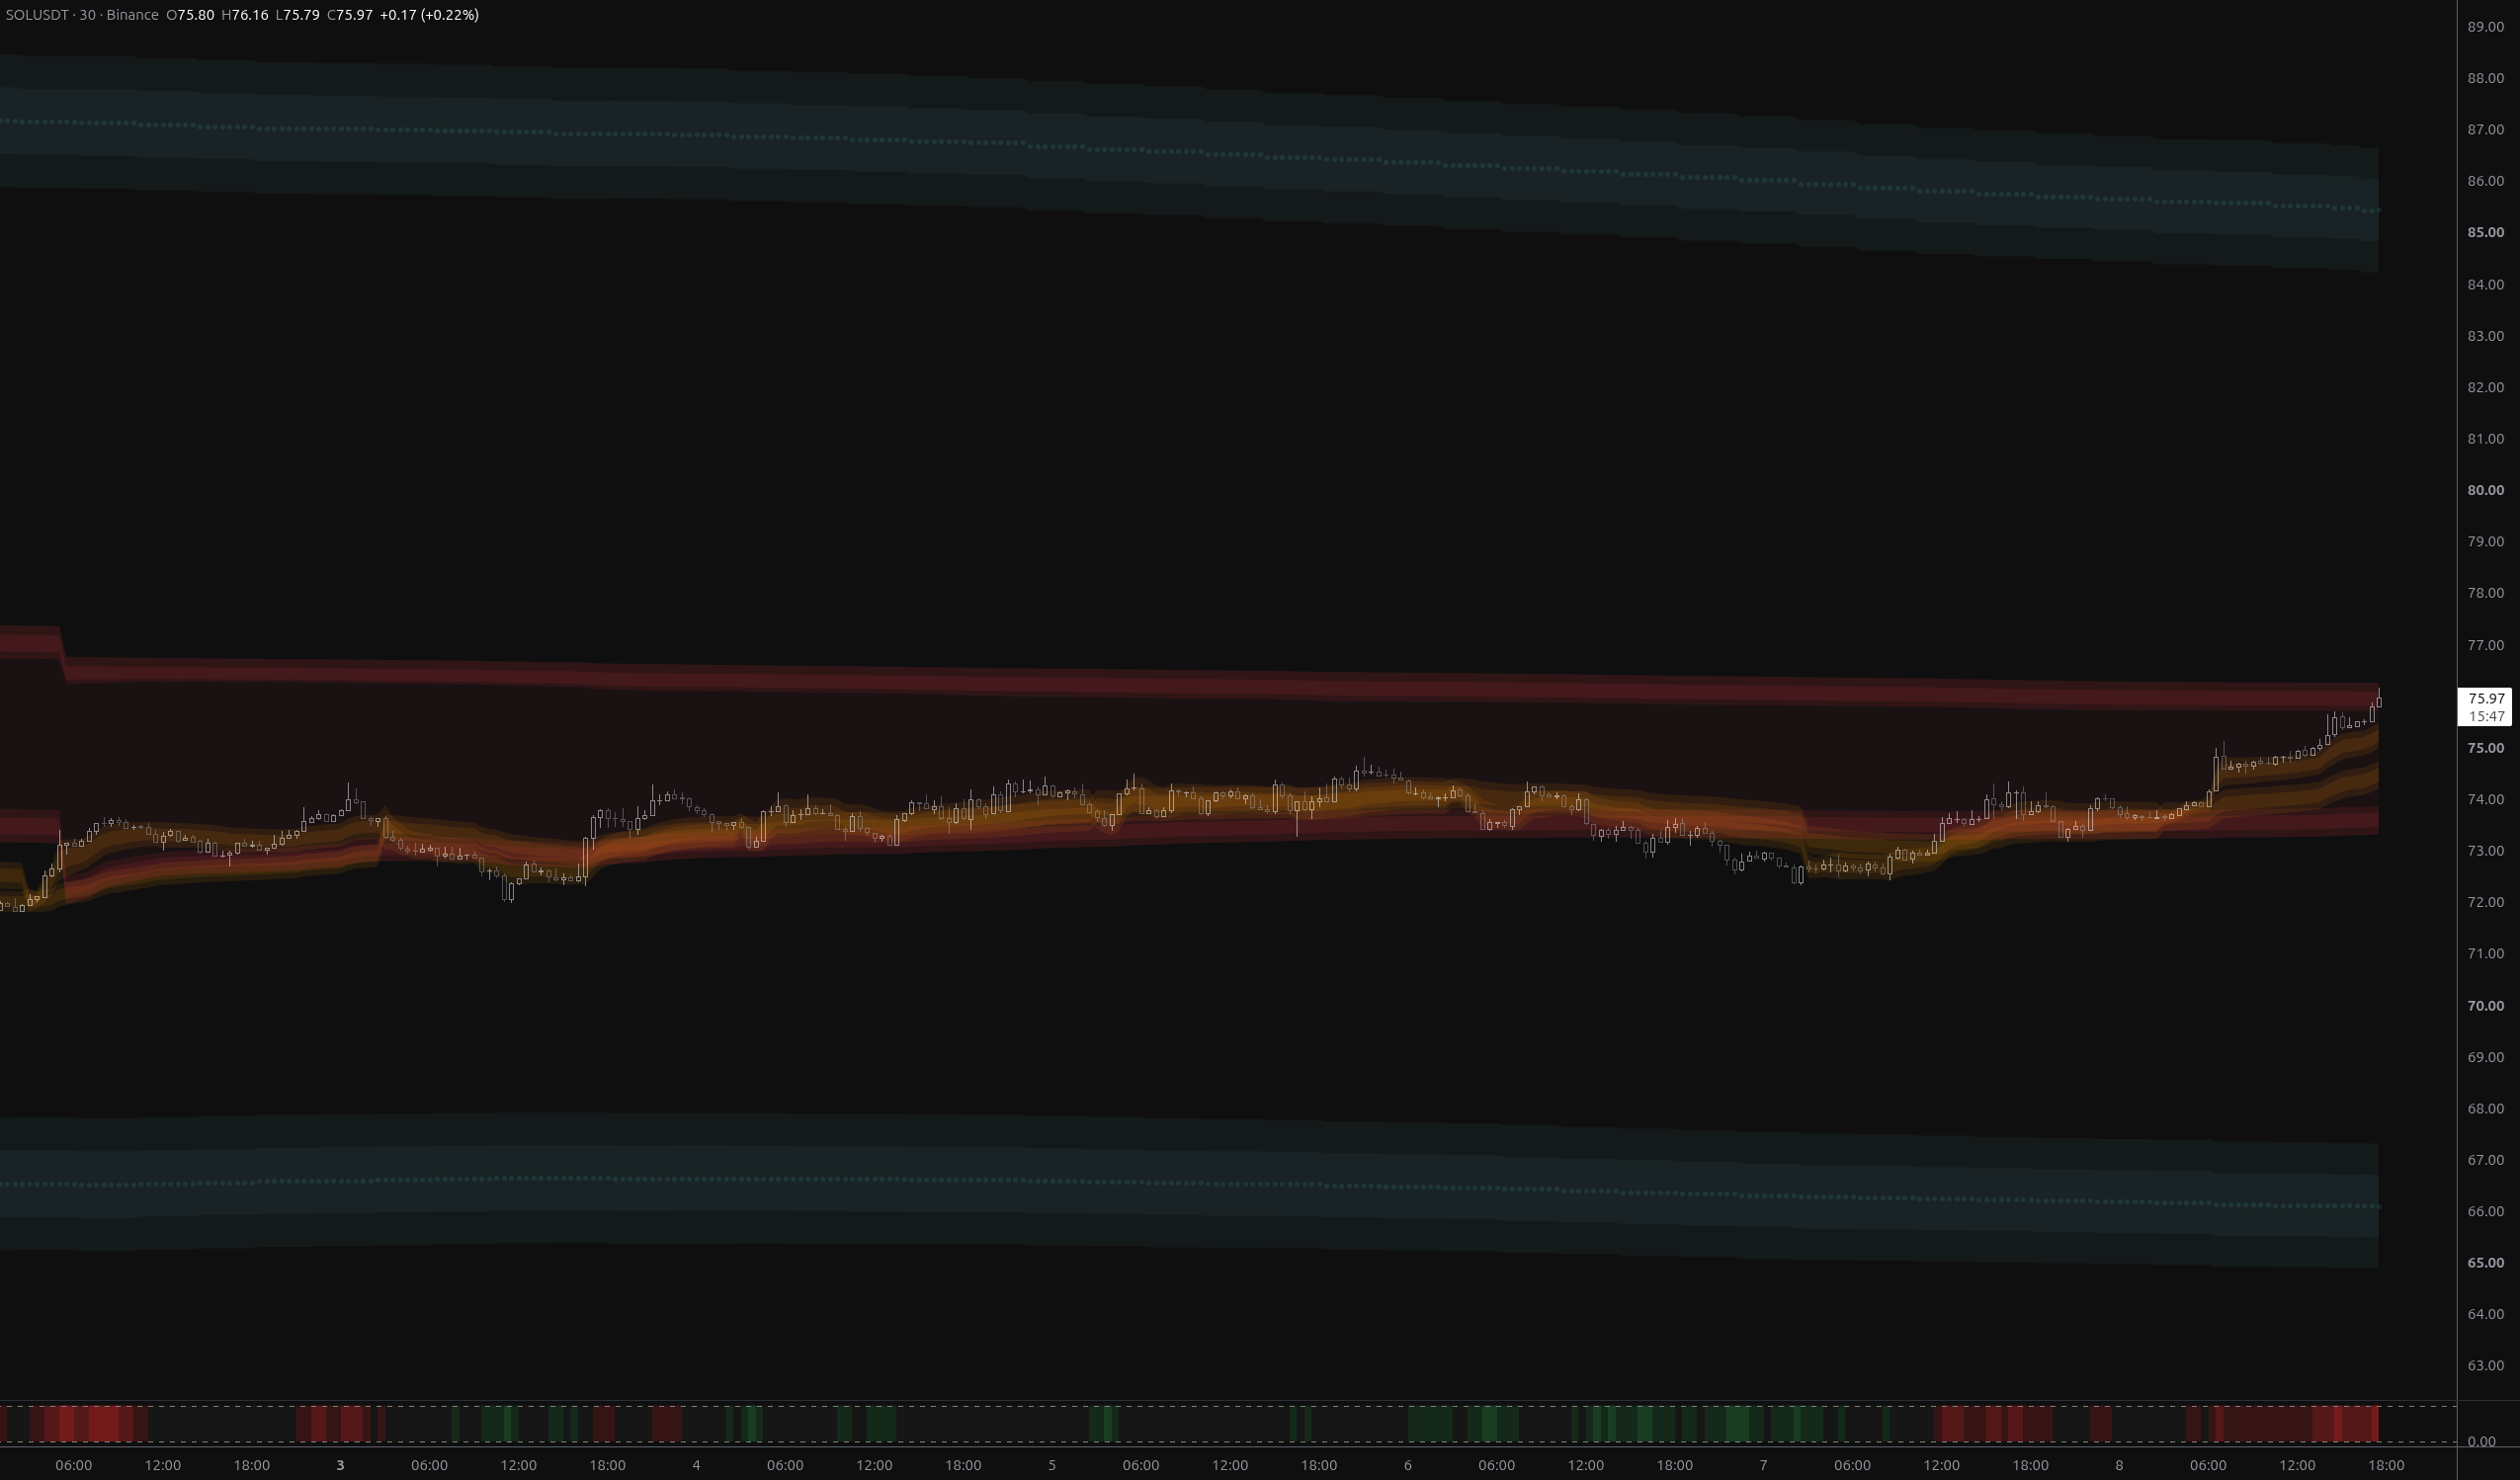
SOLUSDT: Bears Invalidated, $76.27 Now the Test
SOLUSDT has fully reversed the breakdown, reclaiming both fair-value envelopes and flipping its nearest structural band to above_1. The $75.73–$76.27 rail zone is now the decisive test.
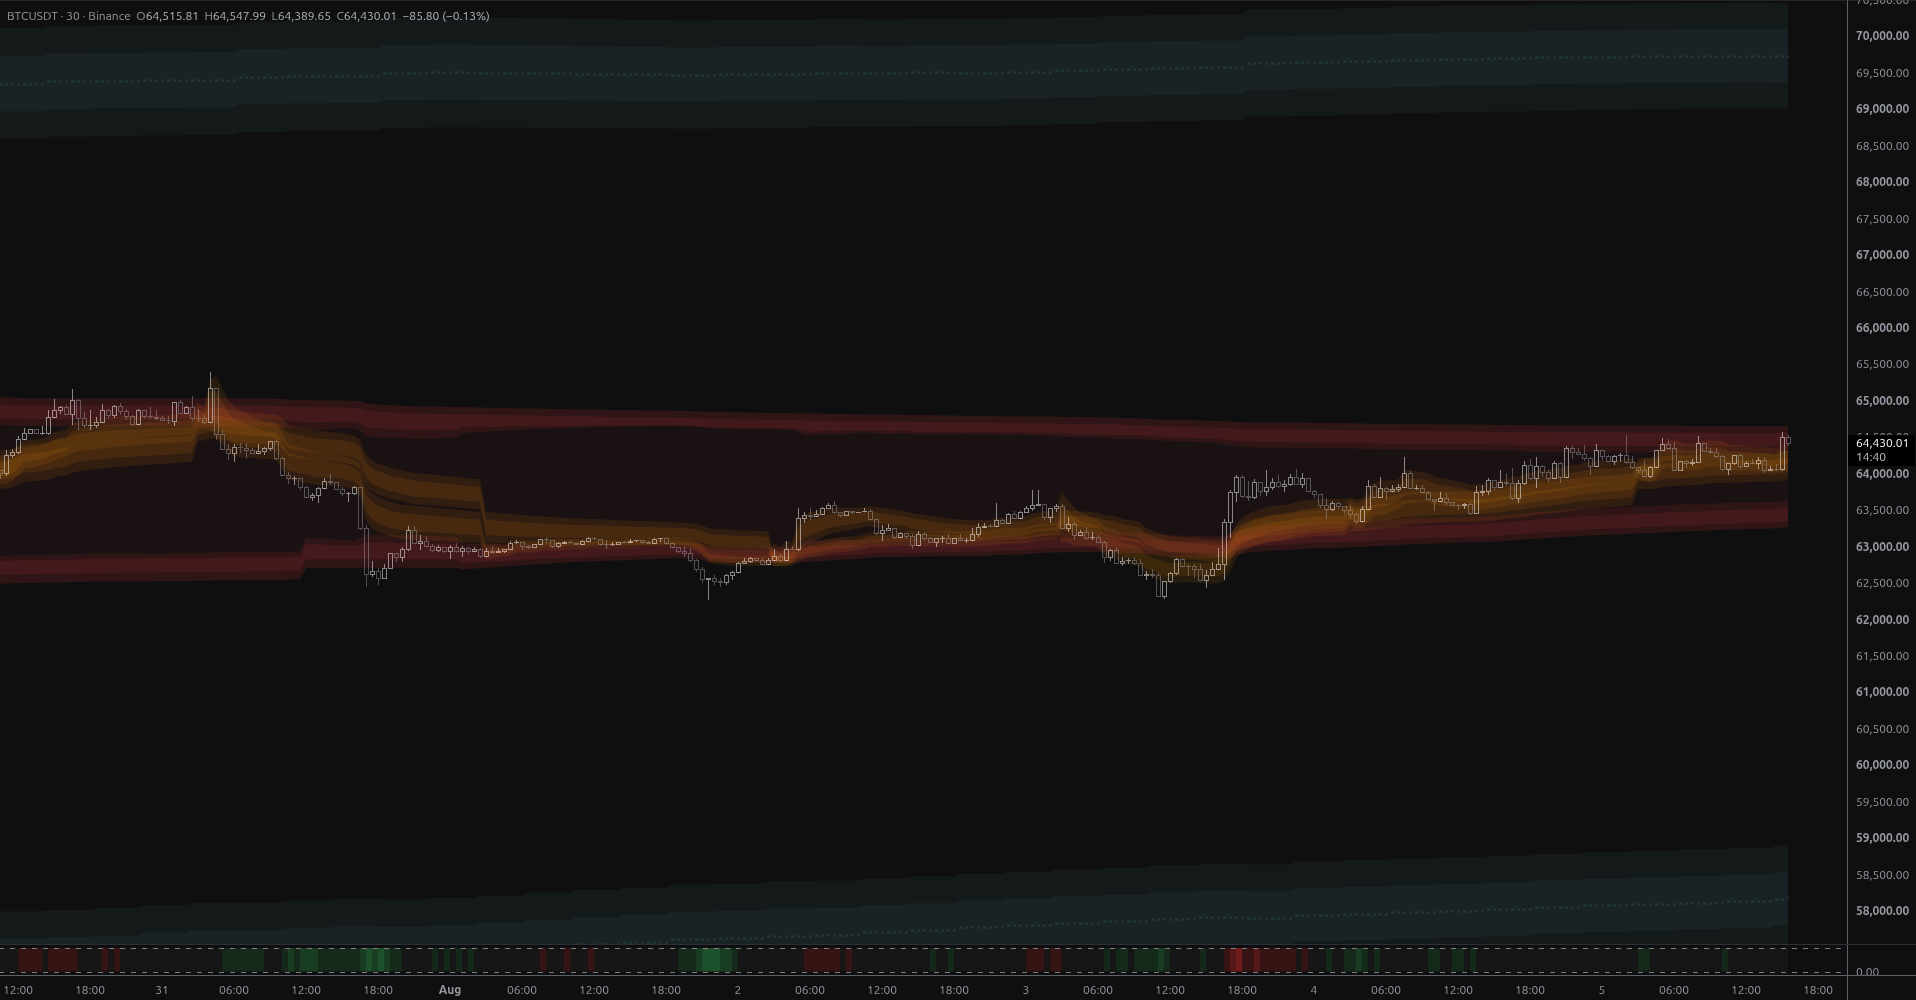
BTCUSDT: Breakout Into Open Structural Air
BTCUSDT broke above week-scale anchored value on 2.7x volume, leaving it stranded in structural open air with the nearest MSL band 6.8% overhead at $68,925 and no support until $59,012.
Connect With Us
Join our community of traders and stay updated with our latest tools and market insights.