
BTC at Critical Breakout Level
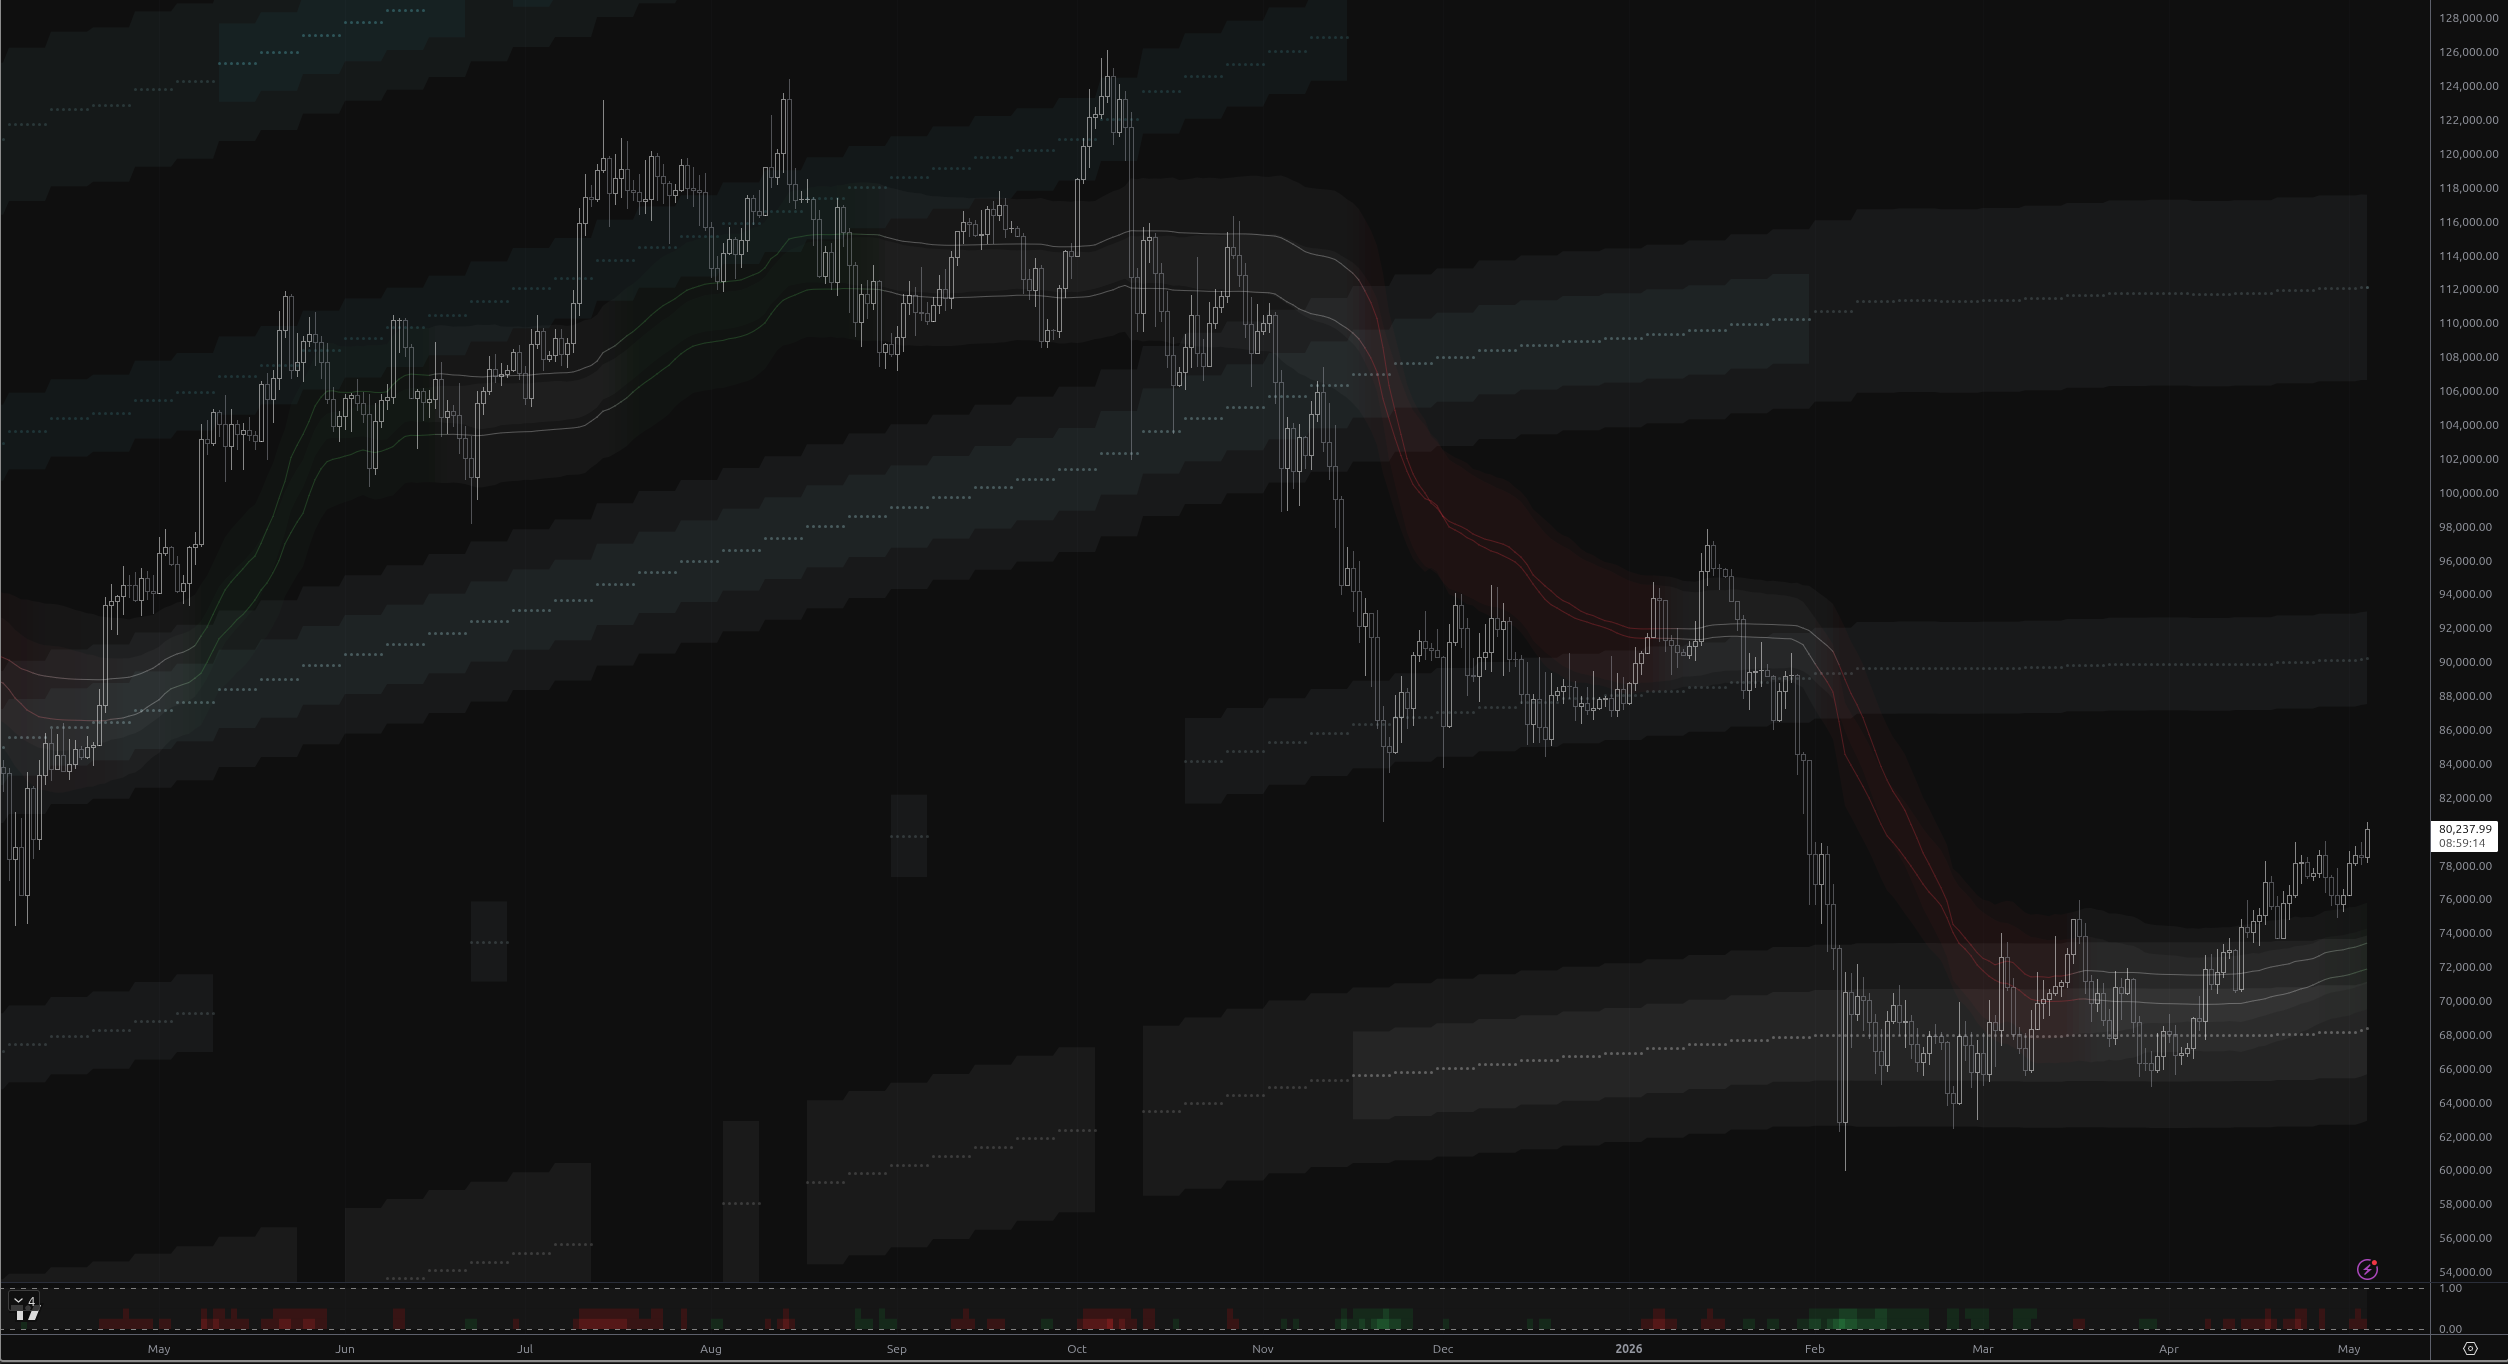
BTC closes at $80,482 after breaking the base band ceiling at $73,956, with five consecutive non-rejected closes signaling potential rotation toward the above_1 band ($84,883–$95,811).
The content on this page is for educational and informational purposes only and does not constitute financial advice. We are not licensed financial advisors or professional traders. Trading involves substantial risk of loss and is not suitable for every investor. Past performance is not indicative of future results. Always do your own research and consult a qualified financial professional before making any investment decisions.
Executive Summary
Bitcoin trades at $80,482 after an aggressive recovery from the November capitulation low of $62,510. Price has clawed its way from the bottom of the MSL base band ($63,028) to its upper boundary ($73,956) and now sits above the band ceiling, having spent 99 consecutive bars inside this structure. The market is at a pivotal inflection point: either this is the early stage of a reclaim of the above_1 band ($84,883–$95,811), or a classic distribution rally setting up a return to the band lows. The regime is mild bearish while the structural state is distribution — a combination that historically demands caution despite the bullish price action.
Trend Overview (AMAB)
The Adaptive MA Bands tell a story of a market still recovering from a major bearish trend. Both MA1 and MA2 slopes are flat (decelerating from a deeply bearish state 8 bars ago). However, price has now closed above the upper bands of both KAMAs for 20 consecutive sessions — a strong sign that downside momentum has fully exhausted. Five touches of the MA1 upper band in the last 7 bars indicate price is using the band as dynamic support, a hallmark of an emerging uptrend. Yet the slopes have not yet flipped bullish, meaning we lack confirmation that this is more than a reflex rally.
Key AMAB Levels
- MA1 upper: ~$75,875 (immediate dynamic support)
- MA1 mid: ~$73,490
- MA2 upper: ~$74,332
- MA2 mid: ~$71,947 (loss of this confirms trend rollover)
MSL Structural Analysis — The Heart of the Setup
The MSL framework reveals the most important context for this market. Price collapsed from above_3 (the $128k–$140k zone) through above_2, above_1, and into the base band over an 8-week distribution sequence that began in early October. The November 21 flush to $62,345 represented an exact test of the base band low ($63,028), where price was decisively absorbed.
The 99-Bar Base Band Consolidation
Since touching the floor, BTC has spent 99 sessions building structure inside the base band. The journey from the lower boundary to the upper boundary has been methodical, with five tests of the band high ($73,865–$73,956) over the last 5 sessions. None of these tests have been rejected — closes have printed at $76,346, $78,231, $78,687, $78,569, and now $80,482, each progressively higher. This is a textbook upper band breakout in progress.
Position and Distance Metrics
- Position in base band: 1.00 (at the absolute ceiling)
- Distance to above_1 (mid: $90,347): 5.47%
- Distance back to base mid: ~15%
- Distance to below_1 ($46,637): 35.26% (deep tail risk)
Scenario Analysis
Scenario 1 (Most Likely): Successful Reclaim of above_1
Price has already broken above $73,956 with conviction. The path of least resistance is a continuation toward the above_1 band lo at $84,883, then the band mid at $90,347. Five consecutive non-rejected closes above the base ceiling, combined with AMAB slopes turning from strong bearish to flat, suggest accumulation pressure is overwhelming the prior distribution narrative. Volume is below average (0.84x), which is somewhat concerning, but the lack of rejection wicks is more important than absolute volume here.
Targets: $84,883 → $90,347 → $95,811 (above_1 hi)
Invalidation: Daily close back below $73,956 with rejection wick
Scenario 2 (Secondary): Bull Trap and Rotation Back to Base Mid
The structural classifier still reads distribution and the regime remains mild bearish. The contracting swing structure (LH at $76,000 vs prior $97,924; HL at $65,000 vs prior $62,510) suggests a triangle that may be resolving with a false breakout. PRO has been overbought-leaning with signal at 0.85 for 3 bars, hinting at exhaustion. If the next 1–3 sessions fail to extend above $80,635, expect rotation back to $73,956 → $68,492 (base mid).
Targets: $73,956 → $68,492
Trigger: Daily close back below $78,200 with momentum divergence
Scenario 3 (Tail Risk): Distribution Resumes, Below_1 Test
The least likely but most dangerous outcome. If the structural state pivots from distribution to a fresh exhaustion print and price loses both the base ceiling and base mid in succession, the next major liquidity pool sits at below_1 ($46,637). This would only activate on a daily close below $63,028 (band low) — currently 21.5% away and would require a fundamental shock.
Regime and Structural Context
The juxtaposition is striking: mild bearish regime with distribution structural state, yet price action that looks corrective-bullish. This combination historically resolves in two ways: either the regime model lags and flips to neutral/mild bullish on confirmation of the breakout (Scenario 1), or the price action is a corrective B-wave inside ongoing distribution (Scenario 2). The structural model has held distribution for 181 bars — a very long read that may be slow to update.
Key Levels Map
| Level | Price | Significance |
|---|---|---|
| above_1 hi | $95,811 | Major resistance, prior distribution zone |
| above_1 mid | $90,347 | Primary upside magnet |
| above_1 lo | $84,883 | First major resistance/breakout target |
| Current | $80,482 | Above base ceiling |
| base hi | $73,956 | Critical breakout level — must hold on retest |
| base mid | $68,492 | Mean reversion target if breakout fails |
| base lo | $63,028 | Cycle low, structural support |
| below_1 mid | $46,637 | Tail risk target |
Conclusion
Bitcoin is at the most consequential structural decision point of the past three months. The 99-bar base band consolidation is ending with an upside resolution attempt that has not yet been invalidated. The weight of evidence — five non-rejected closes above the band ceiling, AMAB trend deceleration from bearish, price holding above both KAMA upper bands — favors continuation toward above_1. However, the regime/structural models still read defensively, and a retest of $73,956 is highly probable before any sustained move higher. The bull case is intact while $73,956 holds on a closing basis; the bear case activates with a daily close below it.
Featured Indicators
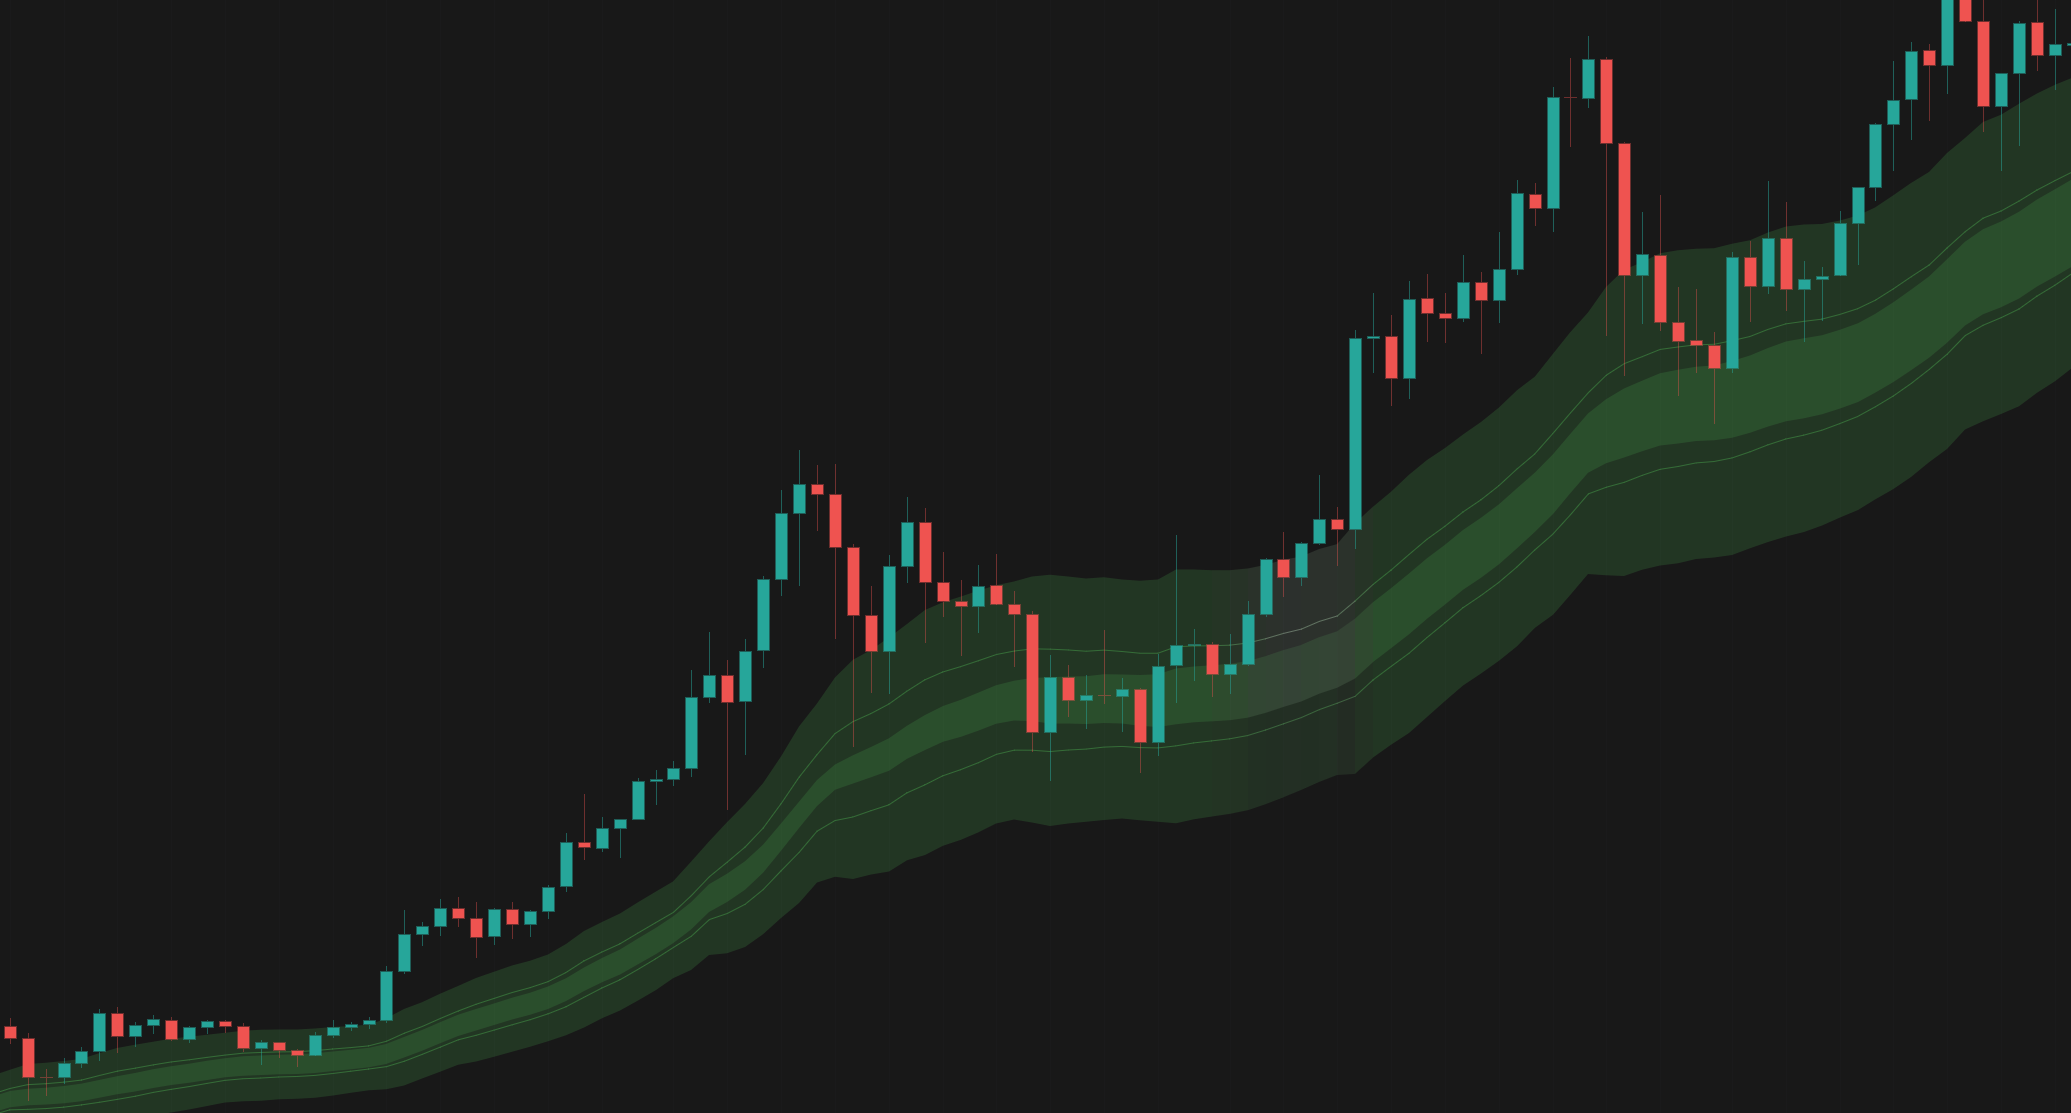
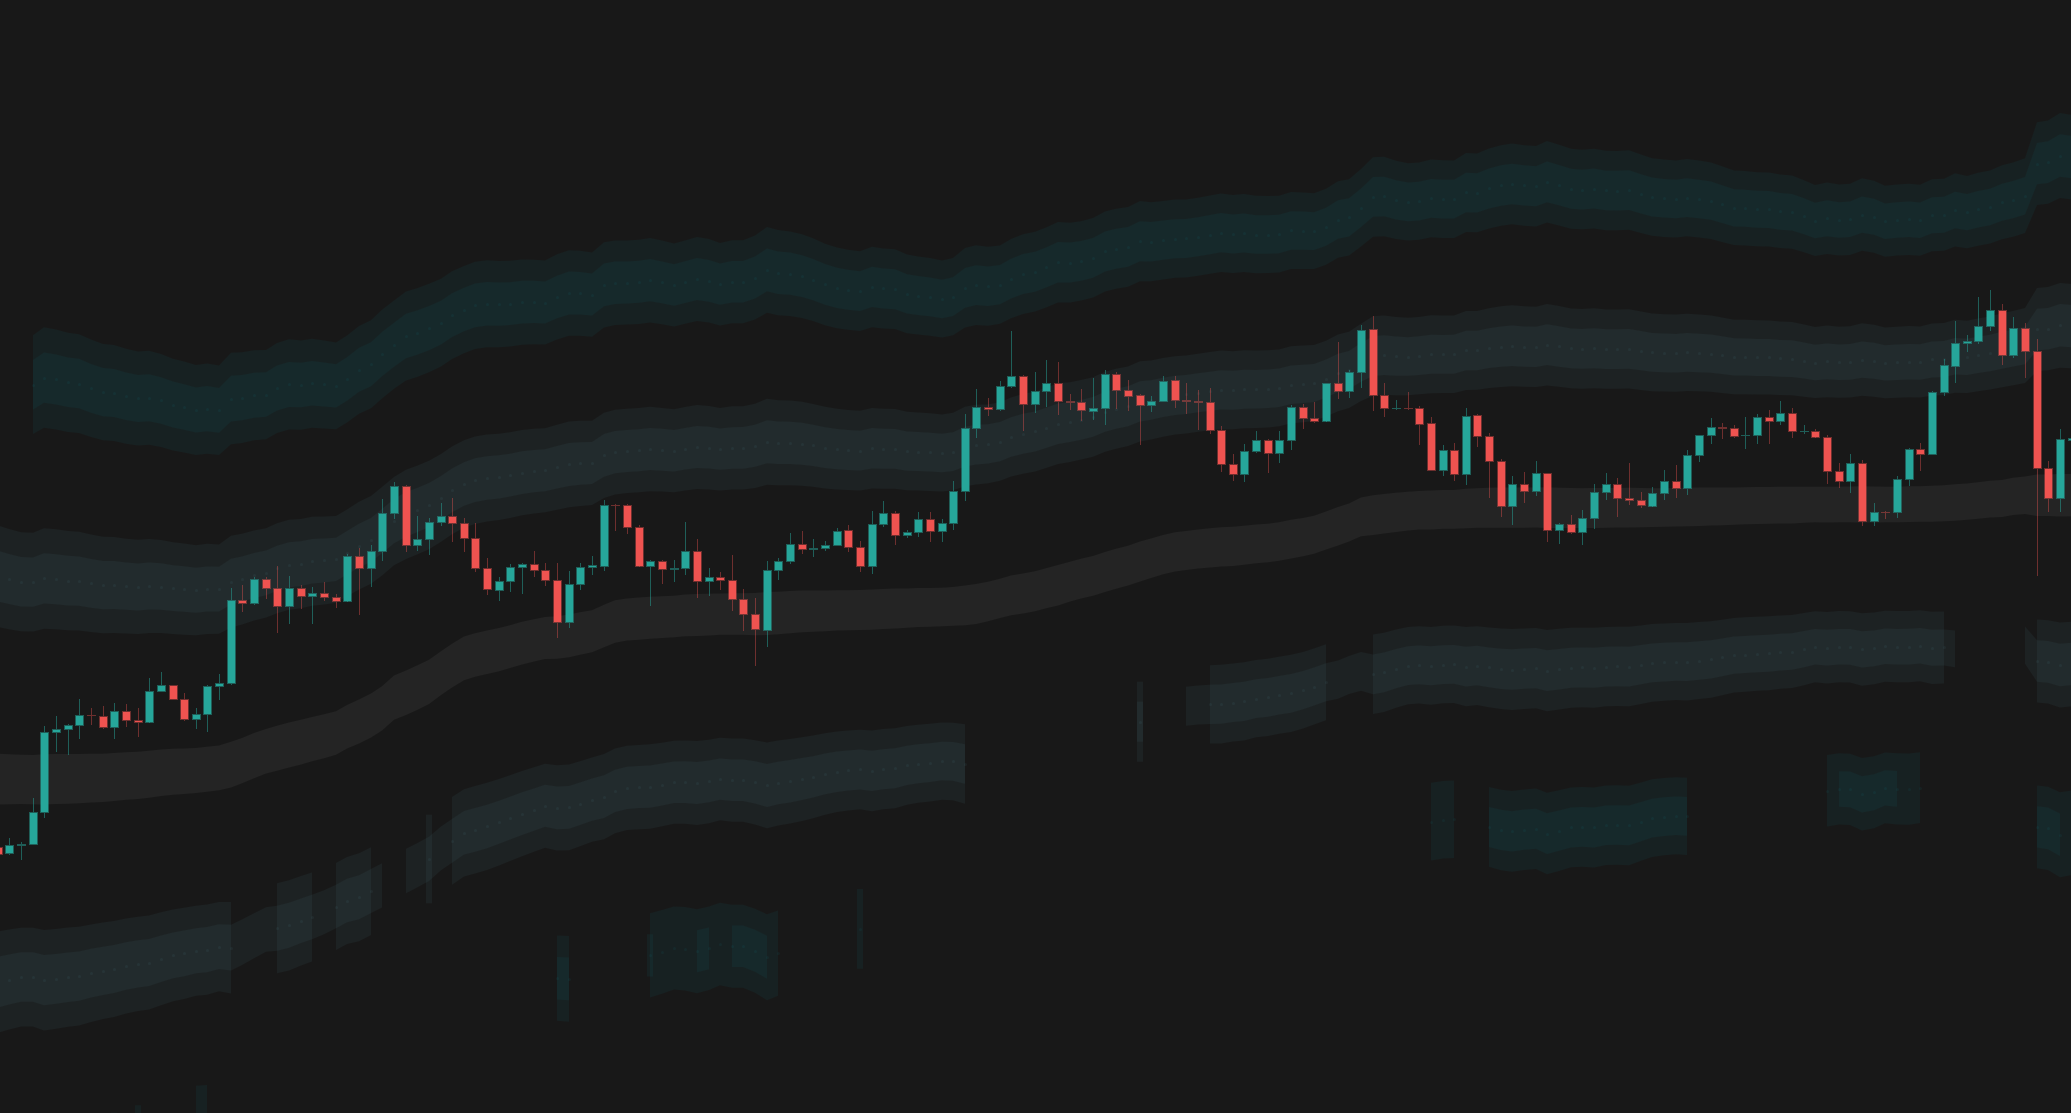
The indicators referenced in this trading idea.
Related Ideas
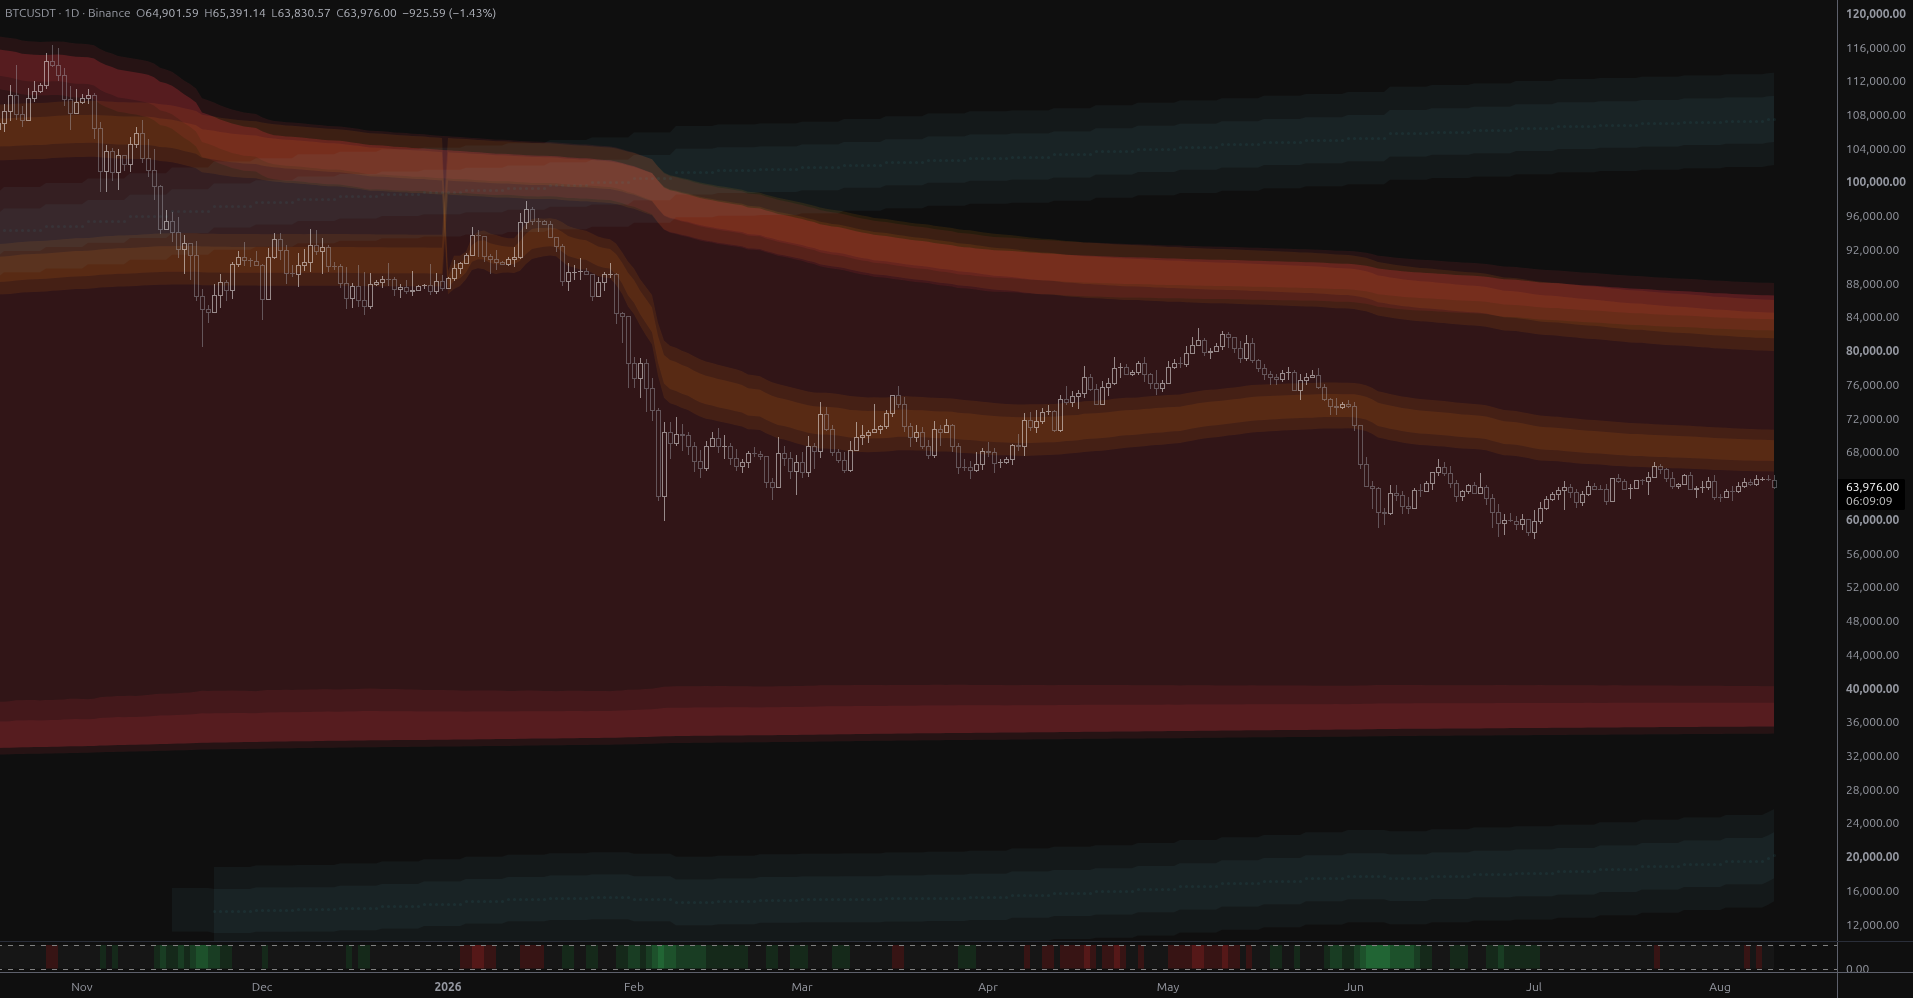
BTC Coils Just Under Its Yearly Value Rail
Bitcoin is coiling at $64,901 just 1.8% below its year-anchored value rail at $66,048, with structural bands far away in both directions. Ranked scenarios, key levels and the air pocket below $57,800.
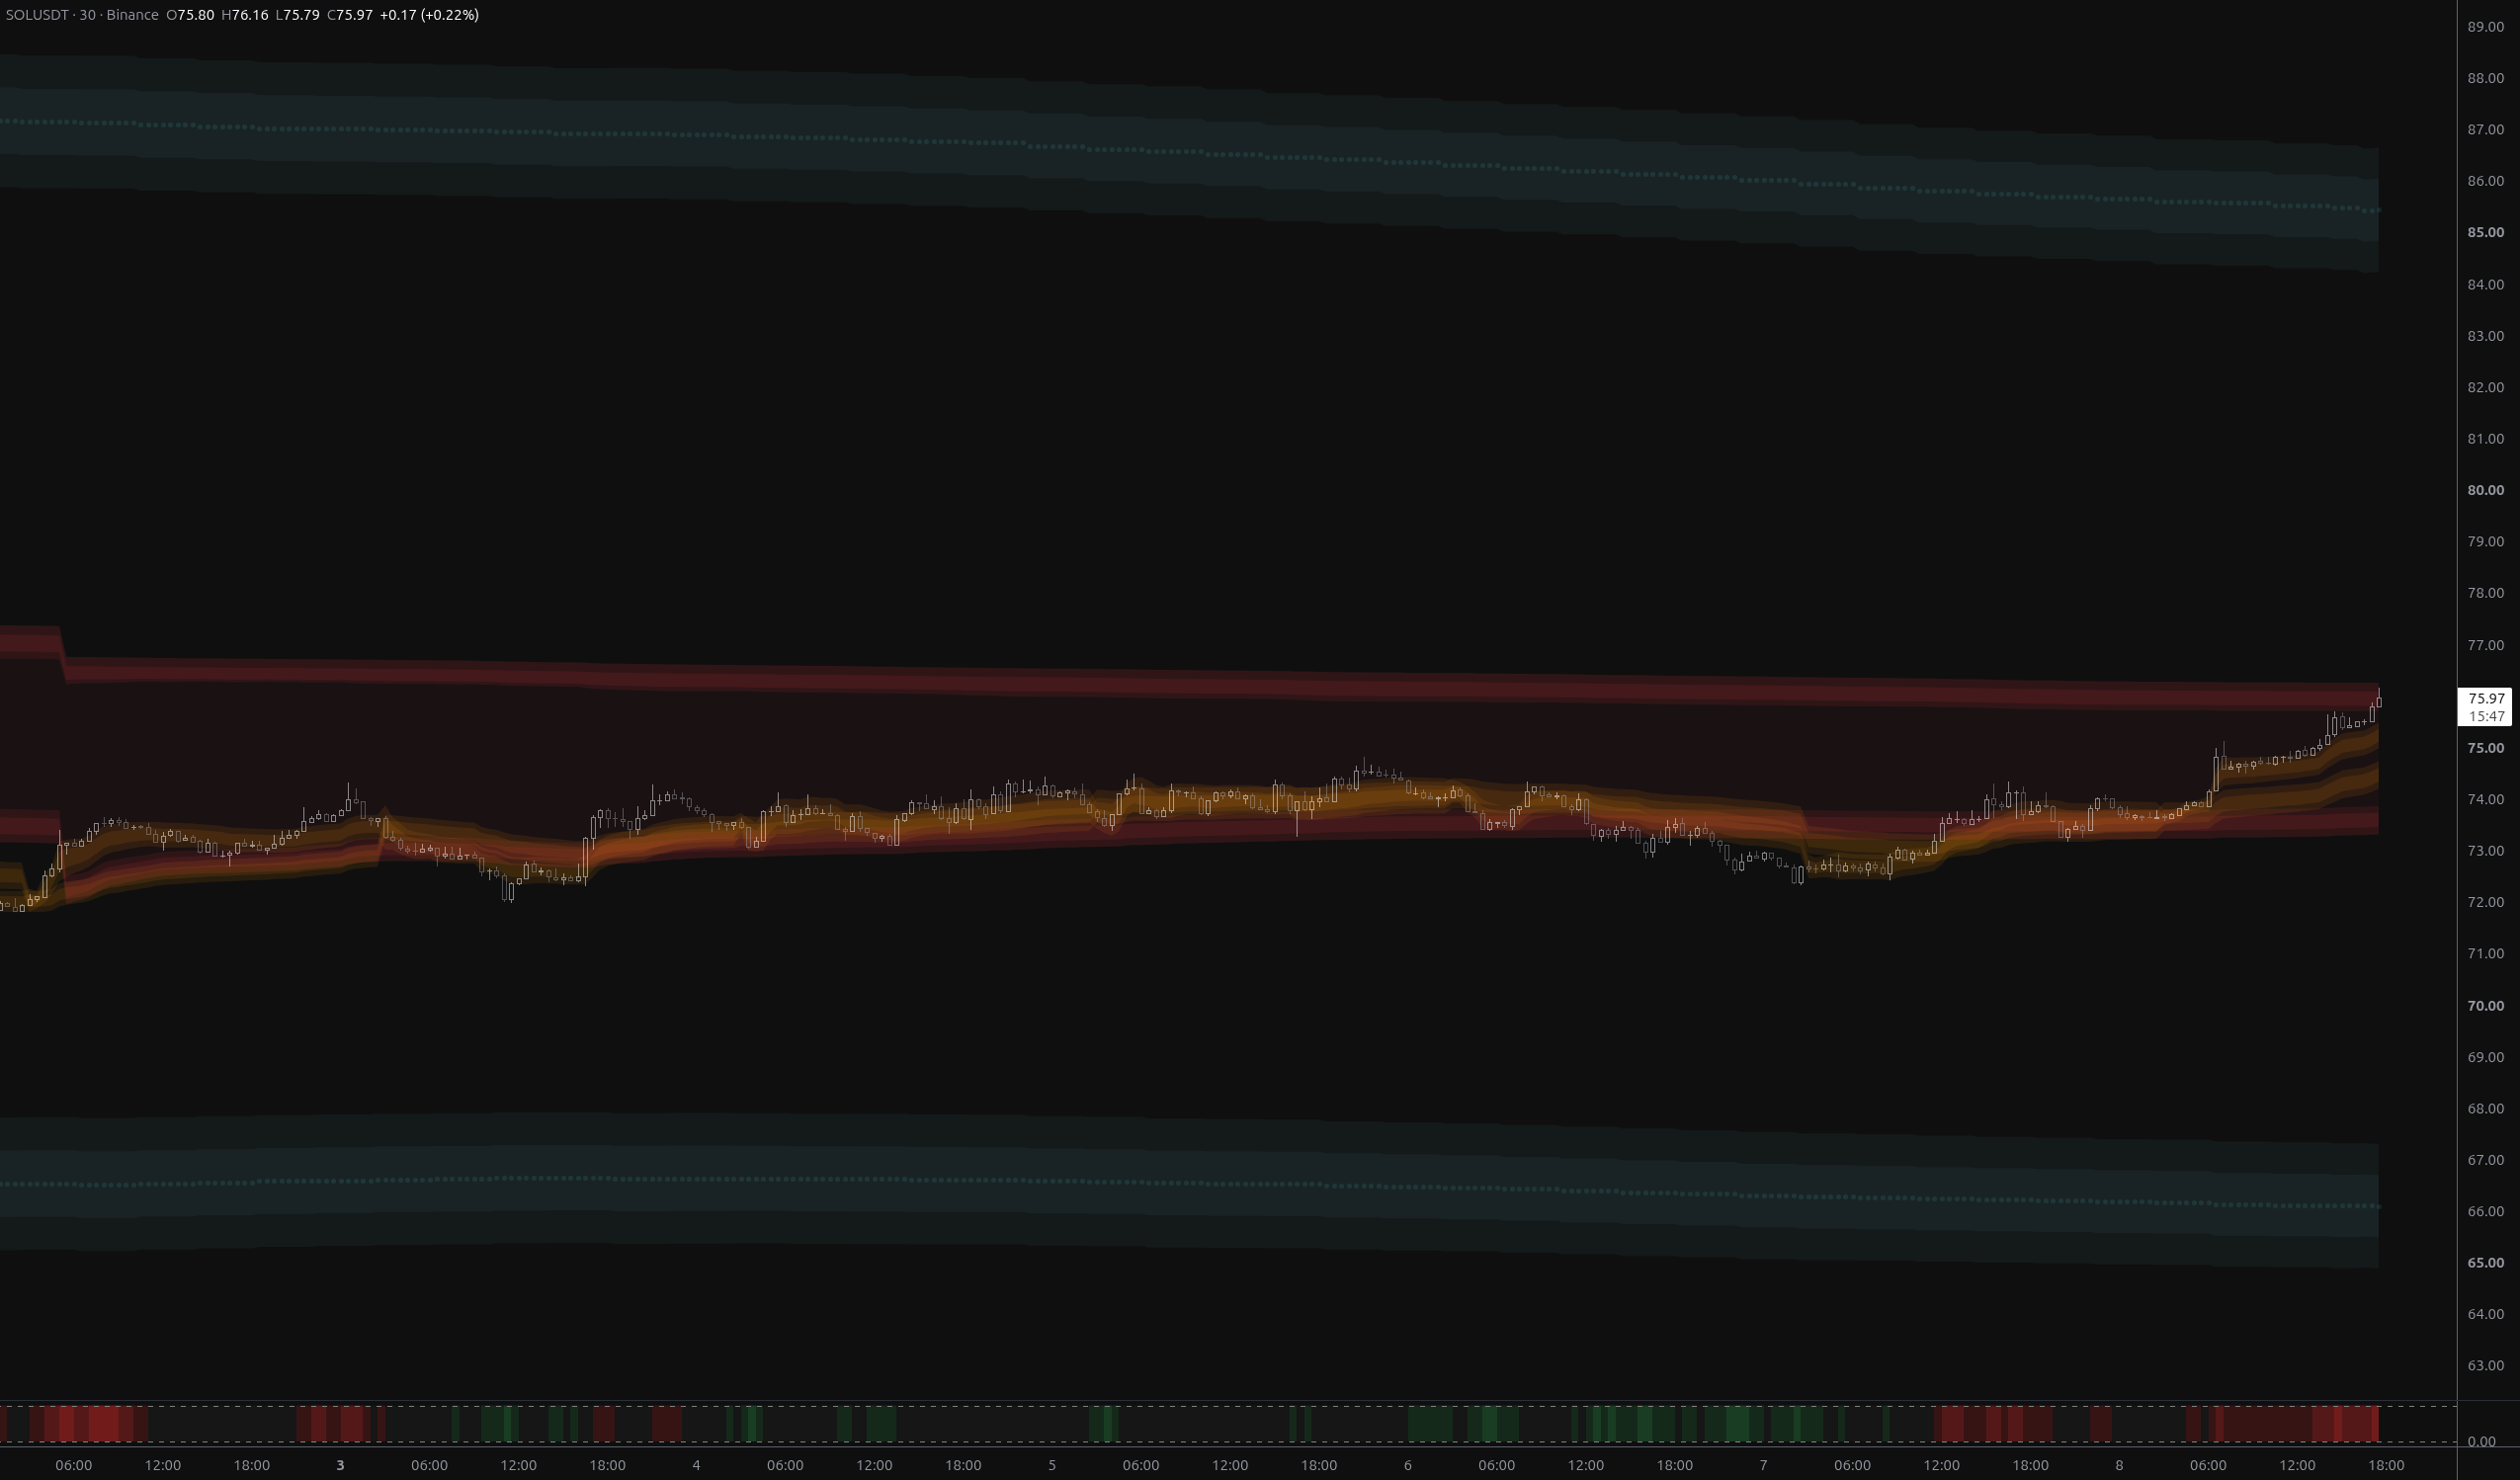
SOLUSDT: Bears Invalidated, $76.27 Now the Test
SOLUSDT has fully reversed the breakdown, reclaiming both fair-value envelopes and flipping its nearest structural band to above_1. The $75.73–$76.27 rail zone is now the decisive test.
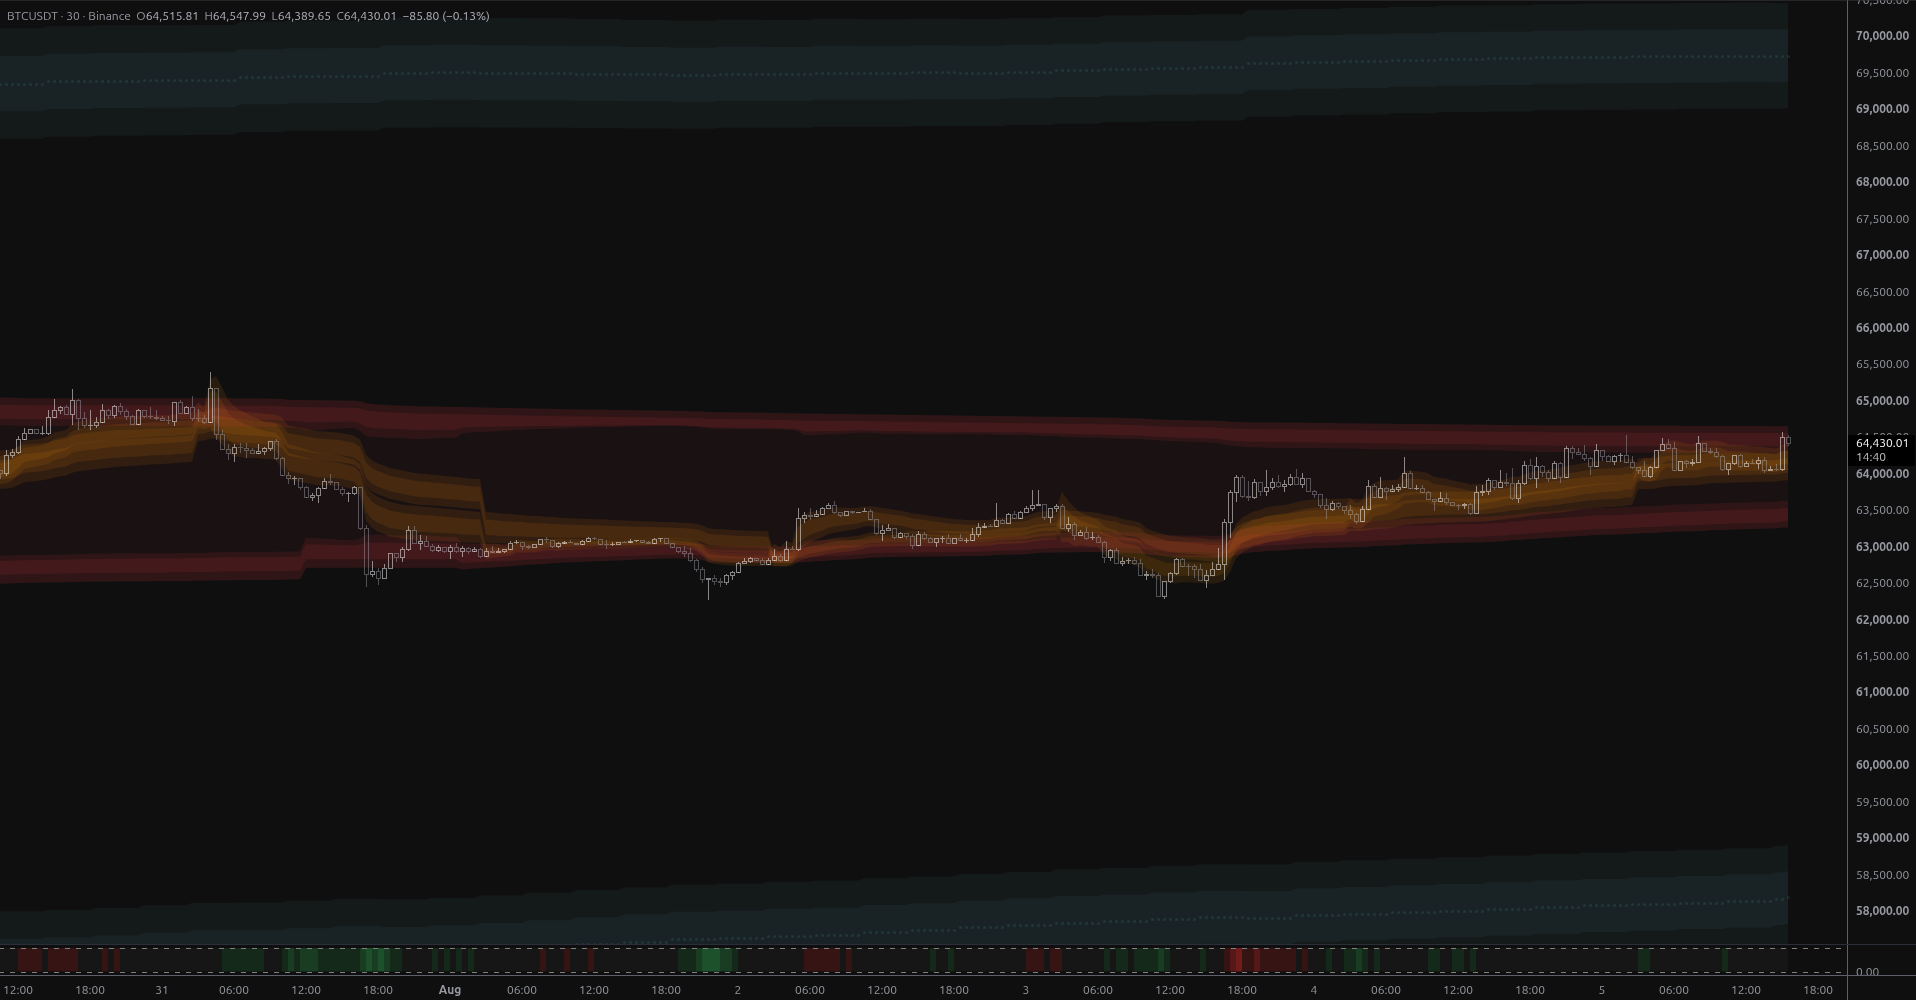
BTCUSDT: Breakout Into Open Structural Air
BTCUSDT broke above week-scale anchored value on 2.7x volume, leaving it stranded in structural open air with the nearest MSL band 6.8% overhead at $68,925 and no support until $59,012.
Connect With Us
Join our community of traders and stay updated with our latest tools and market insights.