
Bitcoin: Exhaustion at the Envelope Floor
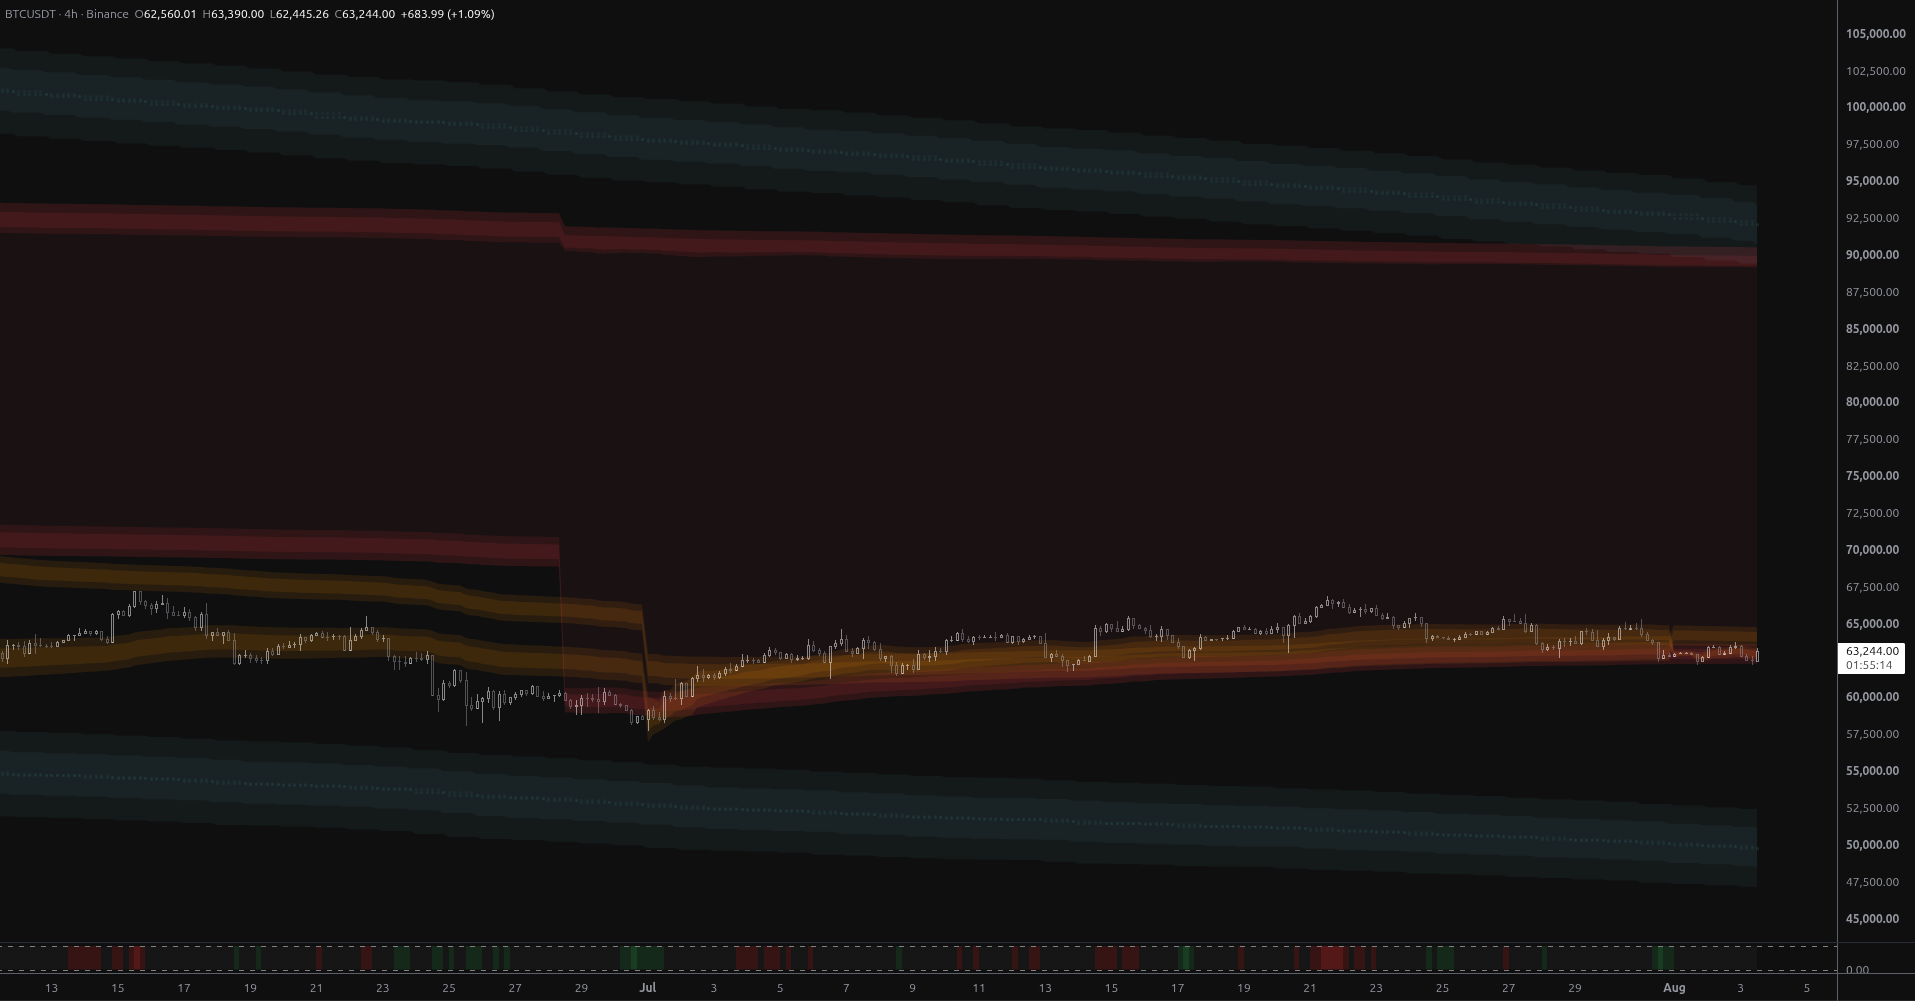
BTCUSDT has rolled over from a rounded top and is grinding below its monthly anchored fair-value envelope. With no MSL structure within 16% either way, $62,335 is the level that decides the next phase.
The content on this page is for educational and informational purposes only and does not constitute financial advice. We are not licensed financial advisors or professional traders. Trading involves substantial risk of loss and is not suitable for every investor. Past performance is not indicative of future results. Always do your own research and consult a qualified financial professional before making any investment decisions.
Executive Summary
BTCUSDT on the 4-hour timeframe has spent the last several weeks carving a broad, rounded top and is now grinding along the lowest rails of both anchored-VWAP envelopes. Price at $62,560 sits below the lower edge of the month-anchored envelope (that rail prints at $62,603) and at the very floor of the pivot-anchored envelope's bottom band ($62,335 – $63,668, fair value $63,002). The structural classifier reads exhaustion with high conviction after rotating out of distribution, while the regime model has settled into neutral following a shift up from bearish. That combination — a lower-high/lower-low swing sequence, a fading momentum profile, but no bearish regime conviction and no volume expansion — describes a market that is bleeding rather than breaking.
Trend Overview
The data window shows a full round trip. Price built from the low-$62,000s up through a persistent step-ladder advance into a peak just under $66,956, then rolled over. What followed is textbook topping geometry rather than an impulsive reversal:
- Lower highs: $66,956 → $65,745 → $65,410.
- Lower lows: $63,740 → $63,059, with intraday probes to $62,466 and $62,275 extending the sequence.
- Compression: the last stretch of bars has coiled into a roughly $62,300–$63,800 band, with each attempt at the upper edge losing amplitude.
The chart image reinforces the read: a rounded, drawn-out top with price now pressed against the underside of the cyan fair-value cluster rather than riding above it. Recent candles carry the same signature — two large bearish engulfing bars within the last handful of sessions, a long upper wick on the attempt at $63,634, and no bullish follow-through after the $63,550 push.
Critically, this is orderly weakness. Relative volume on the current bar is well below its recent average, and the only meaningful volume event in the last two dozen bars was a single bearish expansion candle roughly 17 bars ago that drove the $62,466 low. Sellers are in control of the drift, but they have not yet paid up to force a break.
Level Structure: The MSL Grid
The MSL structural grid delivers the most important longer-term message in this dataset: price has held the below_1 band designation for the entire 730-bar window — an extraordinarily persistent single-band regime — and it sits pinned at the very top of that band's influence, in open air above it.
| Band | Lower edge | Midline | Upper edge | Distance from spot |
|---|---|---|---|---|
| above_1 (next band up) | $89,415 | $92,046 | $94,677 | ~42.9% above |
| below_1 (nearest band) | $47,320 | $49,951 | $52,582 | upper edge ~16% below |
| below_2 (next band down) | $26,273 | $28,904 | $31,535 | ~49.6% below |
Two conclusions follow. First, there is no nearby structural level in either direction. The market is travelling through the void between grid bands, which is why the anchored VWAP rails — not the grid — are doing all of the near-term work. Second, and more subtly, the grid itself has been migrating lower through the window: below_1's upper edge has slid from roughly $55,200 down to $52,582 while spot has stayed in the $62,000–$67,000 zone. Structure is drifting away beneath price. That widens the air pocket underneath and means any genuine structural failure has an unusually long runway before it meets the next shelf.
The recorded level tests are instructive: every recent interaction with below_1's upper edge is logged with closes in the $62,500–$63,600 area and no rejection — confirmation that price is not interacting with the band at all, merely floating far above it. Band-to-band movement, the grid's core thesis, is therefore a multi-week to multi-month proposition here, not a next-session one.
Anchored VWAP: Where the Real Battle Is
Month-anchored view (slower context)
The month-scale envelope re-anchored recently, so it is a young reading and should be weighted accordingly — but its message is unambiguous. Its rails currently sit at $62,603 (lower), $63,026 and $63,449 (lower band centre and top), with the upper structure at $63,995, $64,198 and $64,842. Price has slipped below the entire envelope in the last two bars. Trading beneath a fresh monthly envelope is a stretched, below-fair-value condition relative to every anchor tracked: either the market snaps back inside quickly, or the envelope itself begins to roll over and validate a lower trading shelf.
Pivot-anchored view (structure-tracking)
The pivot envelope's bottom band spans $62,335 to $63,668 with fair value at $63,002, and price has now held the bottom-band zone for eighteen consecutive bars at essentially the floor of the whole envelope. That duration matters. A single tag of a lower rail is a rejection opportunity; eighteen bars of grinding along it is absorption of support, and it is exactly the behaviour that pushed the structural state from distribution into exhaustion. The envelope's upper band is parked far overhead in the high-$89,000s — a stale, extremely stretched anchor with no near-term relevance. Treat the bottom band as the entire actionable structure.
The line in the sand is $62,335. Above it, this is a range base. Below it, price is outside every tracked anchor to the downside with the next structural shelf nearly 16% away.
Regime and Structural Context
- Regime: neutral, high conviction. The model shifted up out of bearish and has held neutral. Neutral regimes historically favour mean reversion around fair value rather than trend extension — which argues against chasing the current slide and in favour of respecting the $63,000 fair-value magnet.
- Structure: exhaustion, high conviction. Overextended relative to support with fading momentum, arrived at from distribution. This is a caution flag for longs and the natural home of topping processes — but it is also the state that most often resolves into range-bound repair rather than immediate collapse.
- Momentum (PRO): flat and drifting lower. The signal is mildly negative, neutral in direction, and has been fading for nine bars. Earlier in the decline it printed oversold readings that produced only shallow bounces — a hallmark of a market where dip-buying is being sold into. There is no oversold extreme here to lean on.
- Volume: contracting. Current activity is below average with only one recent spike, and that spike was bearish. Sellers own direction; nobody owns conviction.
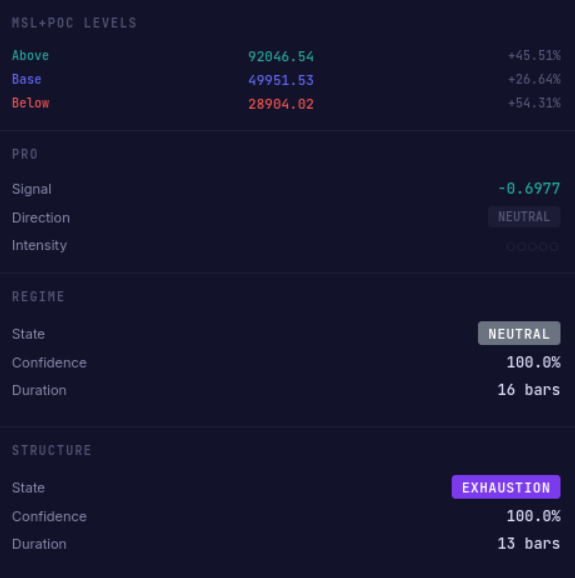
The tension is the story: bearish structure and swing sequence versus neutral regime and contracting volume. That tension typically resolves sideways first.
Scenarios, Most to Least Likely
1. Range repair beneath fair value (most likely)
Price stabilises in the $62,275–$63,668 zone, tests and holds the pivot envelope floor at $62,335, and works back toward fair value at $63,002 without reclaiming the monthly envelope's interior on the first attempt. Expect continued lower-amplitude swings, low volume, and repeated failures in the $63,450–$63,670 band. This fits neutral regime mean-reversion behaviour, the absence of nearby MSL structure, and the eighteen-bar grind along support. Invalidated by: a decisive daily-scale close outside $62,275 or above $63,995.
2. Mean-reversion recovery into the monthly envelope
A reclaim of $63,002 followed by acceptance above $63,449 and $63,668 would flip the below-envelope reading and put $63,995 and $64,198 back in play, with the monthly envelope top at $64,842 as the natural cap. Confirmation would require the structural state to migrate out of exhaustion and volume to expand on the up-bars. Even in this path, the lower-high sequence at $65,410 / $65,745 stays intact until proven otherwise — this is a recovery scenario, not a trend-resumption scenario. Invalidated by: failure to hold $63,002 on the retest, or a rejection wick at $63,668 on rising volume.
3. Structural break and the air pocket
A sustained loss of $62,335 with expanding volume would put price outside every tracked anchor to the downside. The first objectives are the earlier window lows in the $61,300–$61,700 area, and beyond that the market enters the genuine air pocket down toward below_1's upper edge at $52,582, with the band midline at $49,951 as the deeper structural target. This is the highest-magnitude path but requires a change of character: the regime model would need to rotate back toward bearish and volume would need to confirm. Given contracting participation, it is not the base case in the near term — but the drift of the grid lower means the downside, once opened, is unusually unobstructed. Invalidated by: a quick reclaim of $62,603 and re-entry into the monthly envelope.
4. Trend resumption higher (least likely)
Reclaiming $64,842 and then taking out $65,410 and $65,745 would break the lower-high sequence and re-open the window high near $66,956. Only beyond that does the MSL grid's next band up — above_1, from $89,415 through $92,046 — become a conversation, and that is a multi-month structural objective, not a trade. With exhaustion in place, price below the monthly envelope, and momentum fading, this is the lowest-probability path on current evidence. Requires: a structural state shift into breakout plus a bullish regime read.
Key Levels Summary
| Level | Source | Role |
|---|---|---|
| $65,745 / $65,410 | Prior / last swing high | Lower-high sequence; bearish invalidation zone |
| $64,842 | Monthly envelope top | Upper cap of the mean-reversion range |
| $64,198 / $63,995 | Monthly upper line / rail | Recovery targets |
| $63,668 | Pivot bottom-band top | First real resistance; range ceiling |
| $63,449 | Monthly lower-band top | Confirmation of envelope re-entry |
| $63,002 | Pivot fair value | Magnet; the level bulls must reclaim |
| $62,603 | Monthly envelope floor | Currently lost — the stretched condition |
| $62,335 | Pivot envelope floor | Decisive support |
| $62,275 | Recent swing low | Break trigger for scenario 3 |
| $61,300–$61,700 | Earlier window lows | First downside objective on failure |
| $52,582 / $49,951 | MSL below_1 top / mid | Structural downside targets in the air pocket |
| $89,415 / $92,046 | MSL above_1 lower / mid | Distant upside structure |
What Would Change the Read
- Volume. The current drift is low-participation. A high-volume close outside $62,335 or above $63,668 is the signal that the range has resolved; everything inside those rails on light volume is noise.
- Structural state rotation. Exhaustion moving to support base or accumulation would materially strengthen scenarios 1 and 2. Exhaustion rotating back to distribution or resistance cap at a lower high would strengthen scenario 3.
- A new pivot anchor. Because the pivot envelope re-anchors on structure, the appearance of a fresh anchor is itself the signal that the market made a new decision. Watch for the bottom band to reset — that is when the current eighteen-bar support grind is either confirmed as a base or abandoned.
- Regime conviction. Neutral favours reversion. A shift back to bearish removes the main argument against the air-pocket scenario.
Conclusion
This is a market in the repair phase of a rounded top. The swing structure is bearish, the structural classifier reads exhaustion, and price has slipped below the lower edge of its month-anchored envelope — all reasons to withhold benefit of the doubt from the upside. But the regime is neutral, volume is contracting, and the MSL grid places no structure within 16% in either direction, which removes the fuel for immediate directional expansion. The most probable path is continued compression between $62,275 and $63,668 while the market decides whether $63,000 is a ceiling or a floor. The asymmetry to respect is what lies beneath $62,335: with the structural grid drifting lower and the next shelf at $52,582, a confirmed break of the envelope floor would be far more consequential than the size of the candle that causes it.
This is market analysis for educational purposes and does not constitute a trade recommendation.
Featured Indicators
The indicators referenced in this trading idea.
Related Ideas
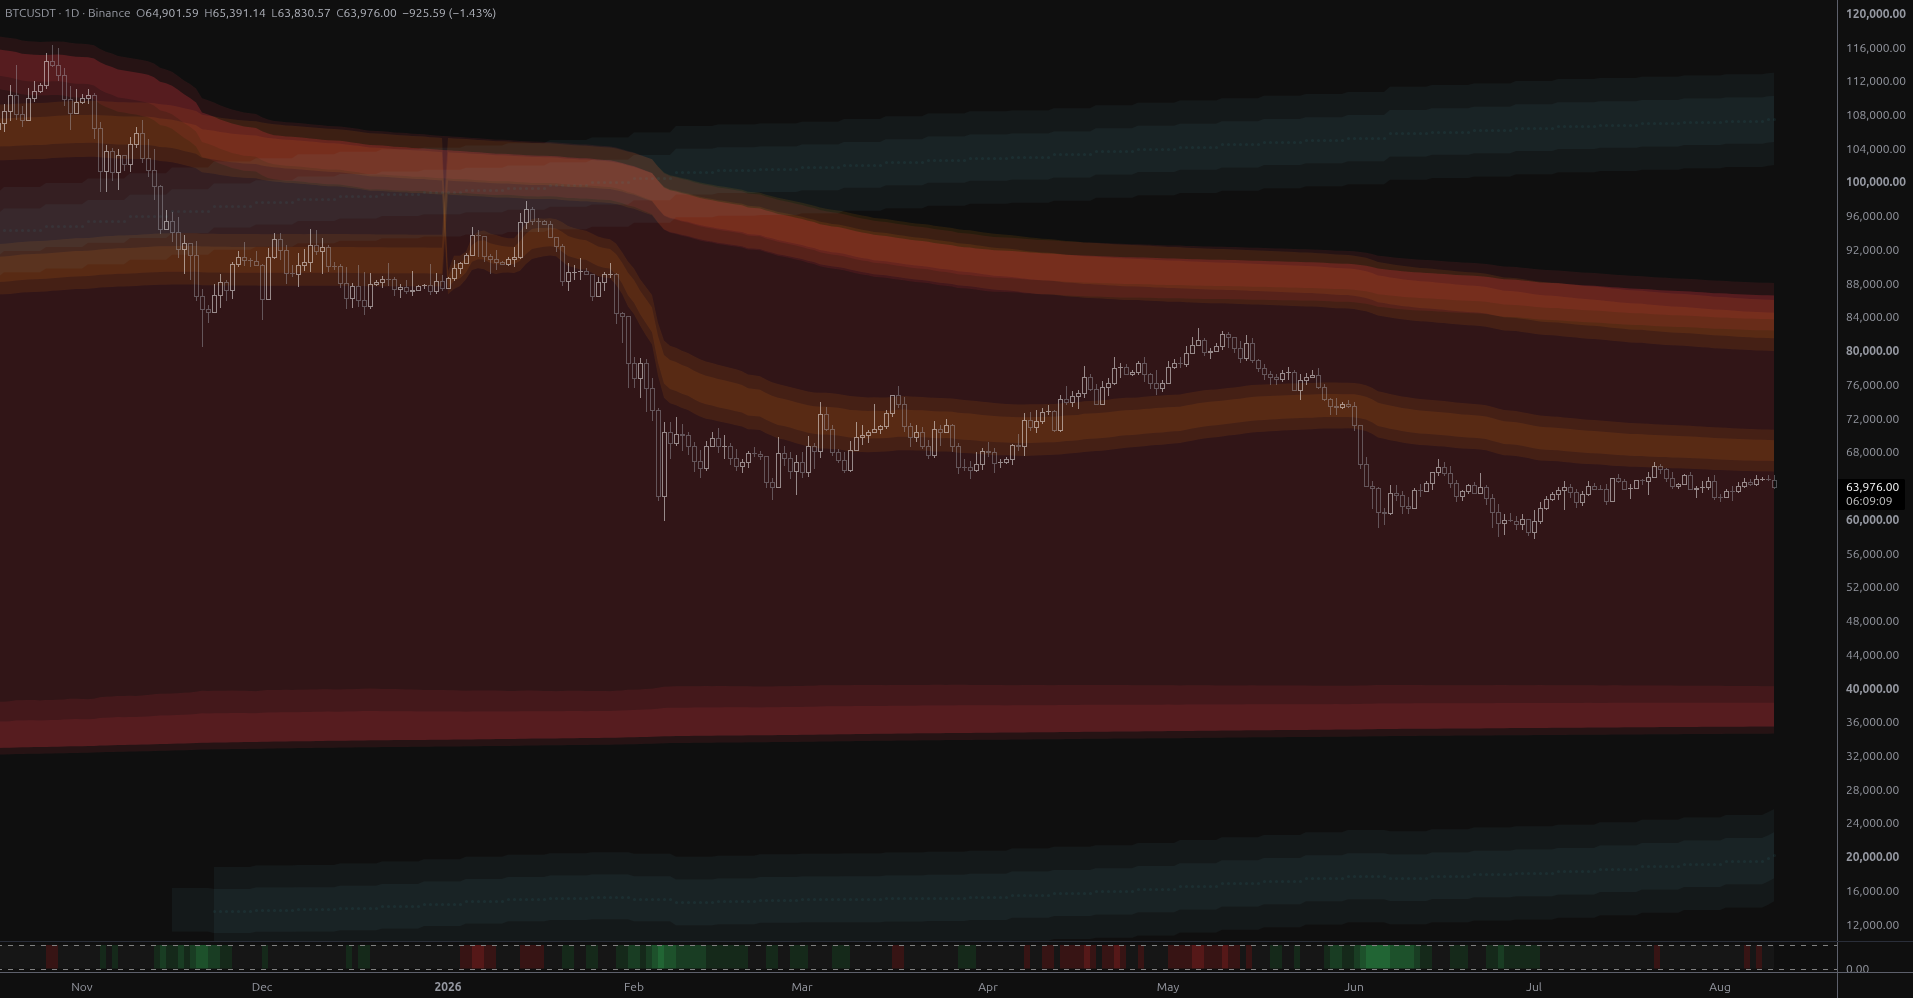
BTC Coils Just Under Its Yearly Value Rail
Bitcoin is coiling at $64,901 just 1.8% below its year-anchored value rail at $66,048, with structural bands far away in both directions. Ranked scenarios, key levels and the air pocket below $57,800.
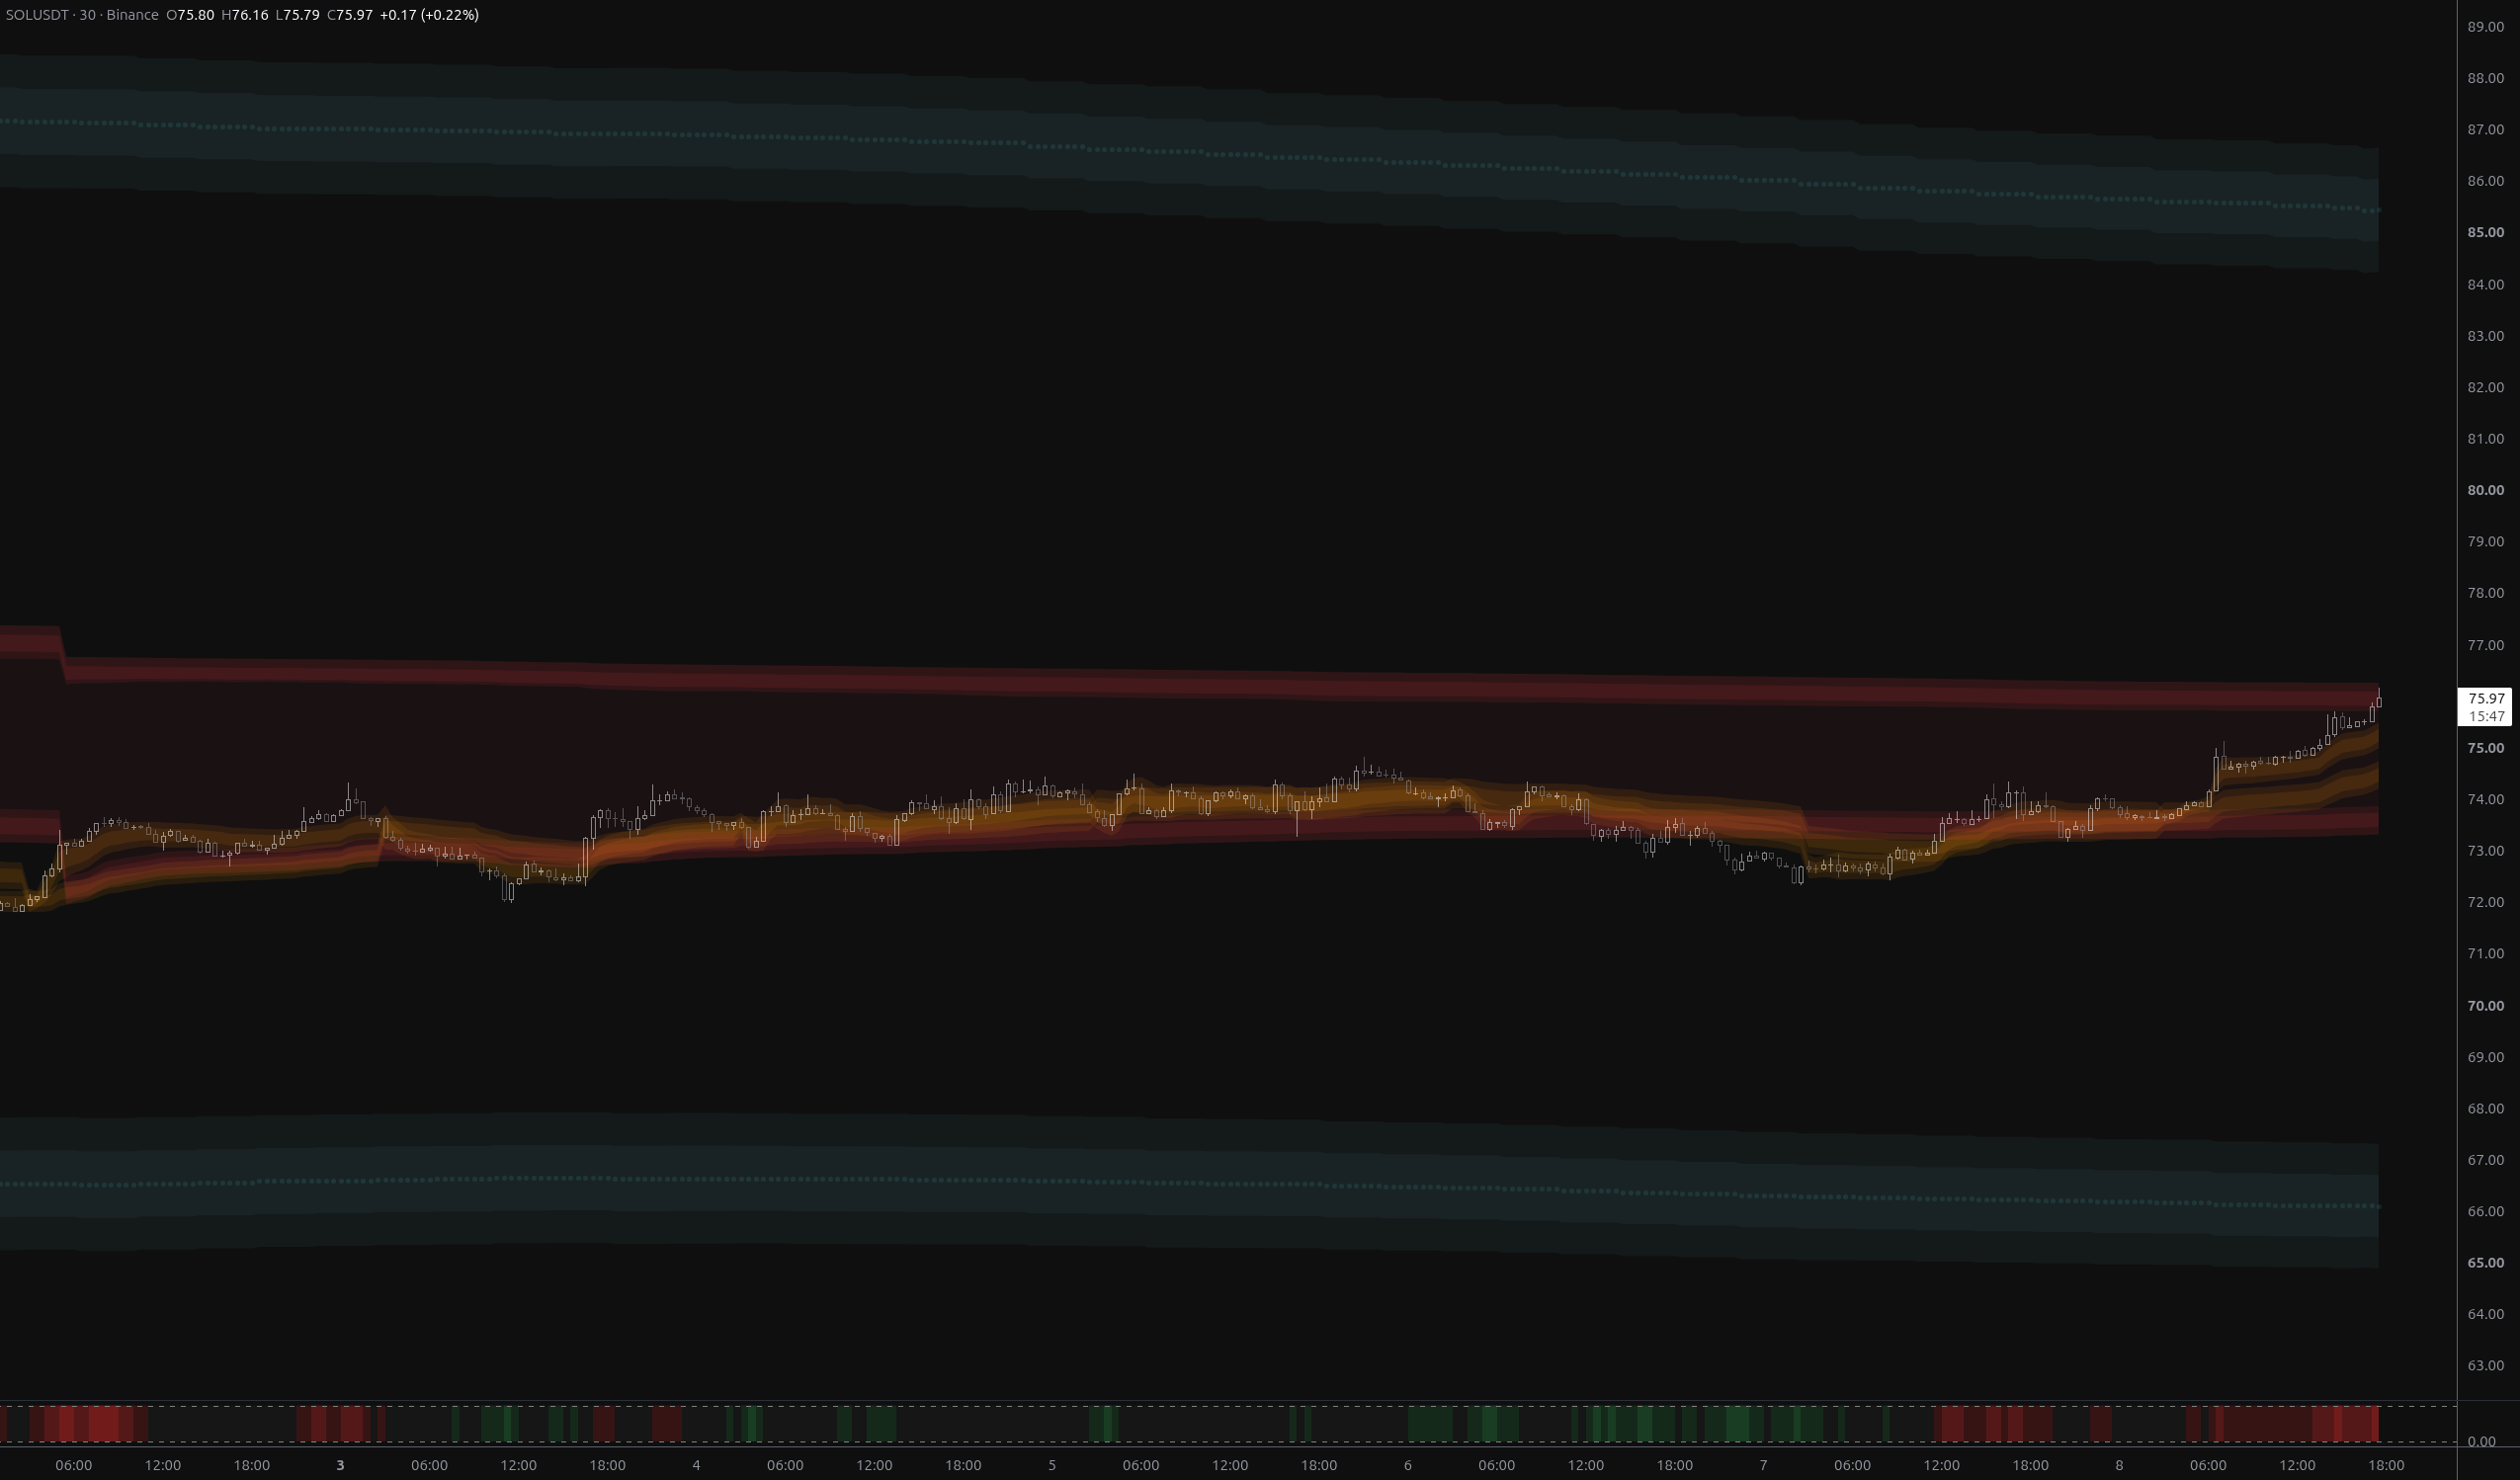
SOLUSDT: Bears Invalidated, $76.27 Now the Test
SOLUSDT has fully reversed the breakdown, reclaiming both fair-value envelopes and flipping its nearest structural band to above_1. The $75.73–$76.27 rail zone is now the decisive test.
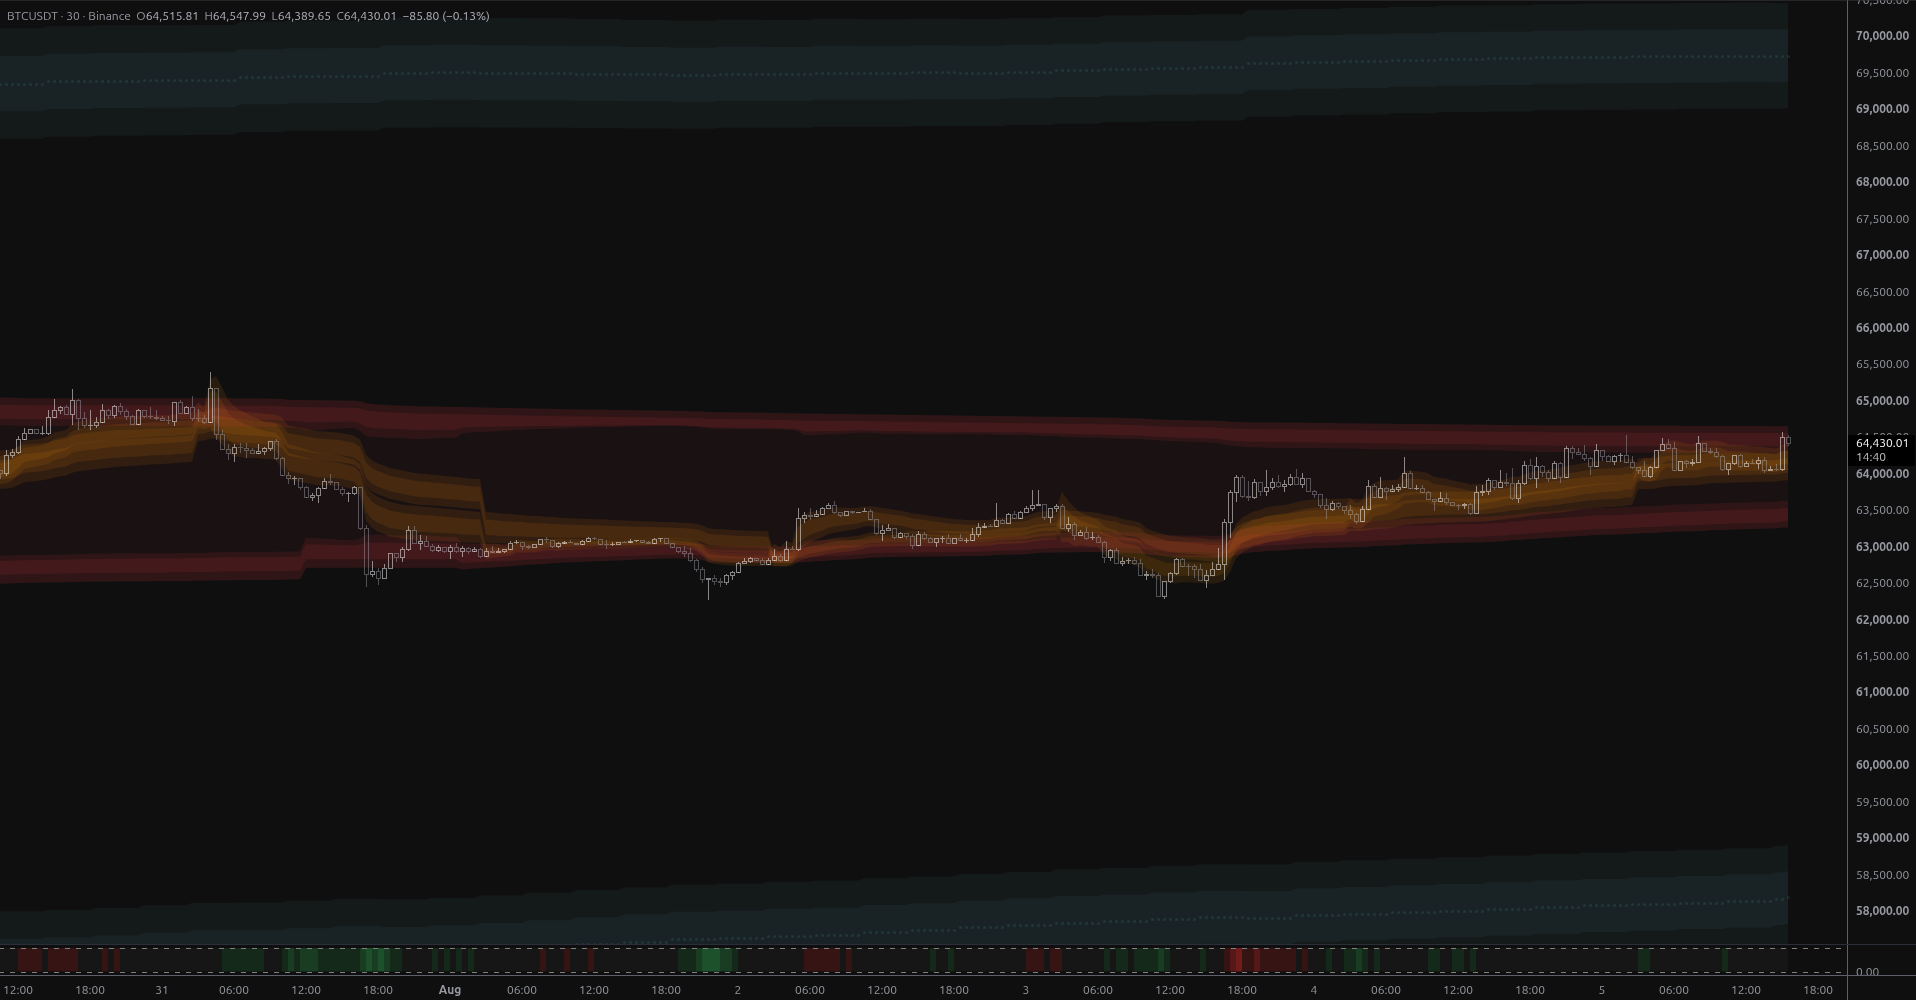
BTCUSDT: Breakout Into Open Structural Air
BTCUSDT broke above week-scale anchored value on 2.7x volume, leaving it stranded in structural open air with the nearest MSL band 6.8% overhead at $68,925 and no support until $59,012.
Connect With Us
Join our community of traders and stay updated with our latest tools and market insights.