Value Area
Heatmap.
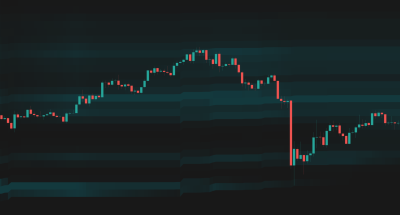
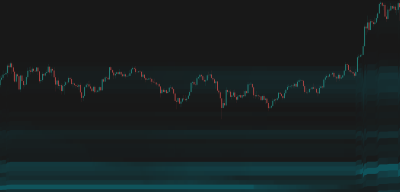
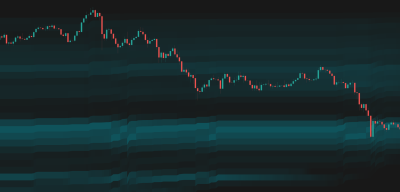
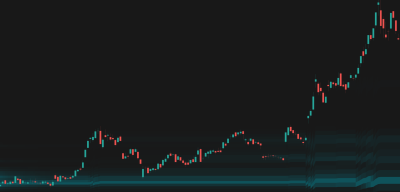
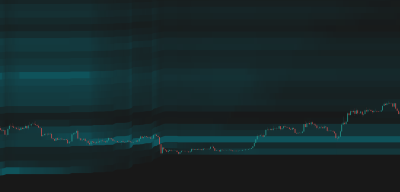
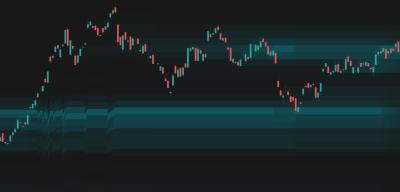
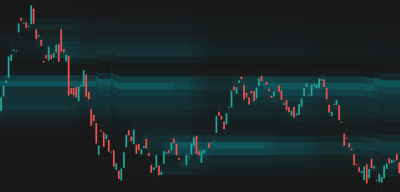
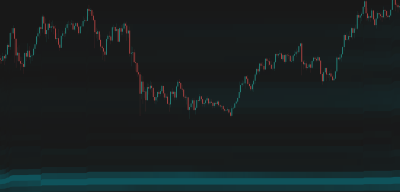
Visualizes volume distribution across price levels using a dynamic heatmap, highlighting high-liquidity zones and low-volume nodes.

Crash bottom - BTCUSD, 1D
Overview
The Problem
Traditional volume bars only show volume per time period, not per price level. This makes it difficult to identify where the real support and resistance levels are based on actual trading activity.
The Solution
Value Area Heatmap projects volume onto the Y-axis (price) using a color-coded heatmap. It automatically anchors to significant time periods or uses a rolling window, making it easy to spot the Point of Control (POC) and liquidity voids.
Who It's For
Day traders, swing traders, and order flow traders looking for volume-backed support/resistance and value areas.
Key Features
Dual Modes: Choose between Anchored (resets at specific time intervals) or Rolling (fixed lookback window) volume profiles.
Auto-Anchoring: Automatically selects the best anchor period (Session, Week, Month, etc.) based on your current chart timeframe.
Dynamic Heatmap: Uses multiple price channels with customizable transparency mapping to visualize volume intensity.
Advanced Transparency: Choose between Weighted or Sequential calculation formulas, and Normal or Inversed modes to highlight either high or low volume nodes.
Theme Awareness: Pre-built styling for Light and Dark modes, plus custom color options.
How It Works
Volume Distribution
The indicator divides the price range of the selected period into multiple horizontal channels. It then distributes the volume of each candle across the channels it overlaps, proportional to the price action.
Heatmap Rendering
Channels are colored based on their relative volume. By default, higher volume channels are more opaque (visible), while lower volume channels are more transparent. This creates a visual 'heatmap' of trading activity.
Point of Control (POC)
The channel with the highest accumulated volume is identified as the Point of Control (POC), representing the fairest price for that period.
How To Use
Quickstart
- Add Value Area Heatmap to your chart.
- Select your preferred Mode (Anchored is great for session trading, Rolling for continuous analysis).
- If using Anchored, leave Anchor Type on 'Auto' or select a specific period like 'Session' or 'Week'.
- Look for the brightest/most opaque bands—these are high volume nodes (Support/Resistance).
- Look for the darkest/most transparent bands—these are low volume nodes (liquidity voids where price moves quickly).
Interpretation
- High Volume Nodes (HVN): Areas of high opacity. Price tends to chop or consolidate here as it represents 'fair value'. They act as strong support or resistance.
- Low Volume Nodes (LVN): Areas of high transparency. Price tends to move quickly through these zones as there is little historical liquidity to stop it.
- Point of Control (POC): The single highest volume level. It acts as a magnet for price and a strong pivot point.
Visual Legend
| Element | Meaning | Interpretation | Common Mistake |
|---|---|---|---|
| Opaque/Bright Bands | High Volume Nodes (HVN) — areas of heavy trading activity. | Expect price to slow down, consolidate, or reverse here. | Expecting price to easily slice through these thick zones. |
| Transparent/Dark Bands | Low Volume Nodes (LVN) — liquidity voids. | Expect fast price movement through these areas. | Placing tight stops in the middle of an LVN. |
Settings Reference
Main
Advanced
Style
Alert Types
POC Crossed
Triggered when the price crosses above or below the Point of Control (POC).
Entered Low Volume Zone
Triggered when the price enters a channel that is in the bottom 25% of volume for the current profile.
Frequently Asked Questions
If you are using 'Anchored' mode, the profile resets at the beginning of each new anchor period (e.g., a new day or week) to show only the volume for that specific period.
The indicator looks at your chart's timeframe. For example, on a 5-minute chart, it anchors to the Session. On a 1-hour chart, it anchors to the Month.
The POC is represented by the most opaque channel in the heatmap. The indicator calculates the exact price internally for alerts, but visually it is shown as a zone.
Related Indicators
Other indicators that complement Value Area Heatmap.
Connect With Us
Join our community of traders and stay updated with our latest tools and market insights.