
Bitcoin Testing the Ceiling of the Base Band
Bitcoin tests the $75,009 base band ceiling for the second time in three days, but collapsing volume (0.22x average), a mild bearish regime, and persistent distribution state suggest this rally faces significant headwinds
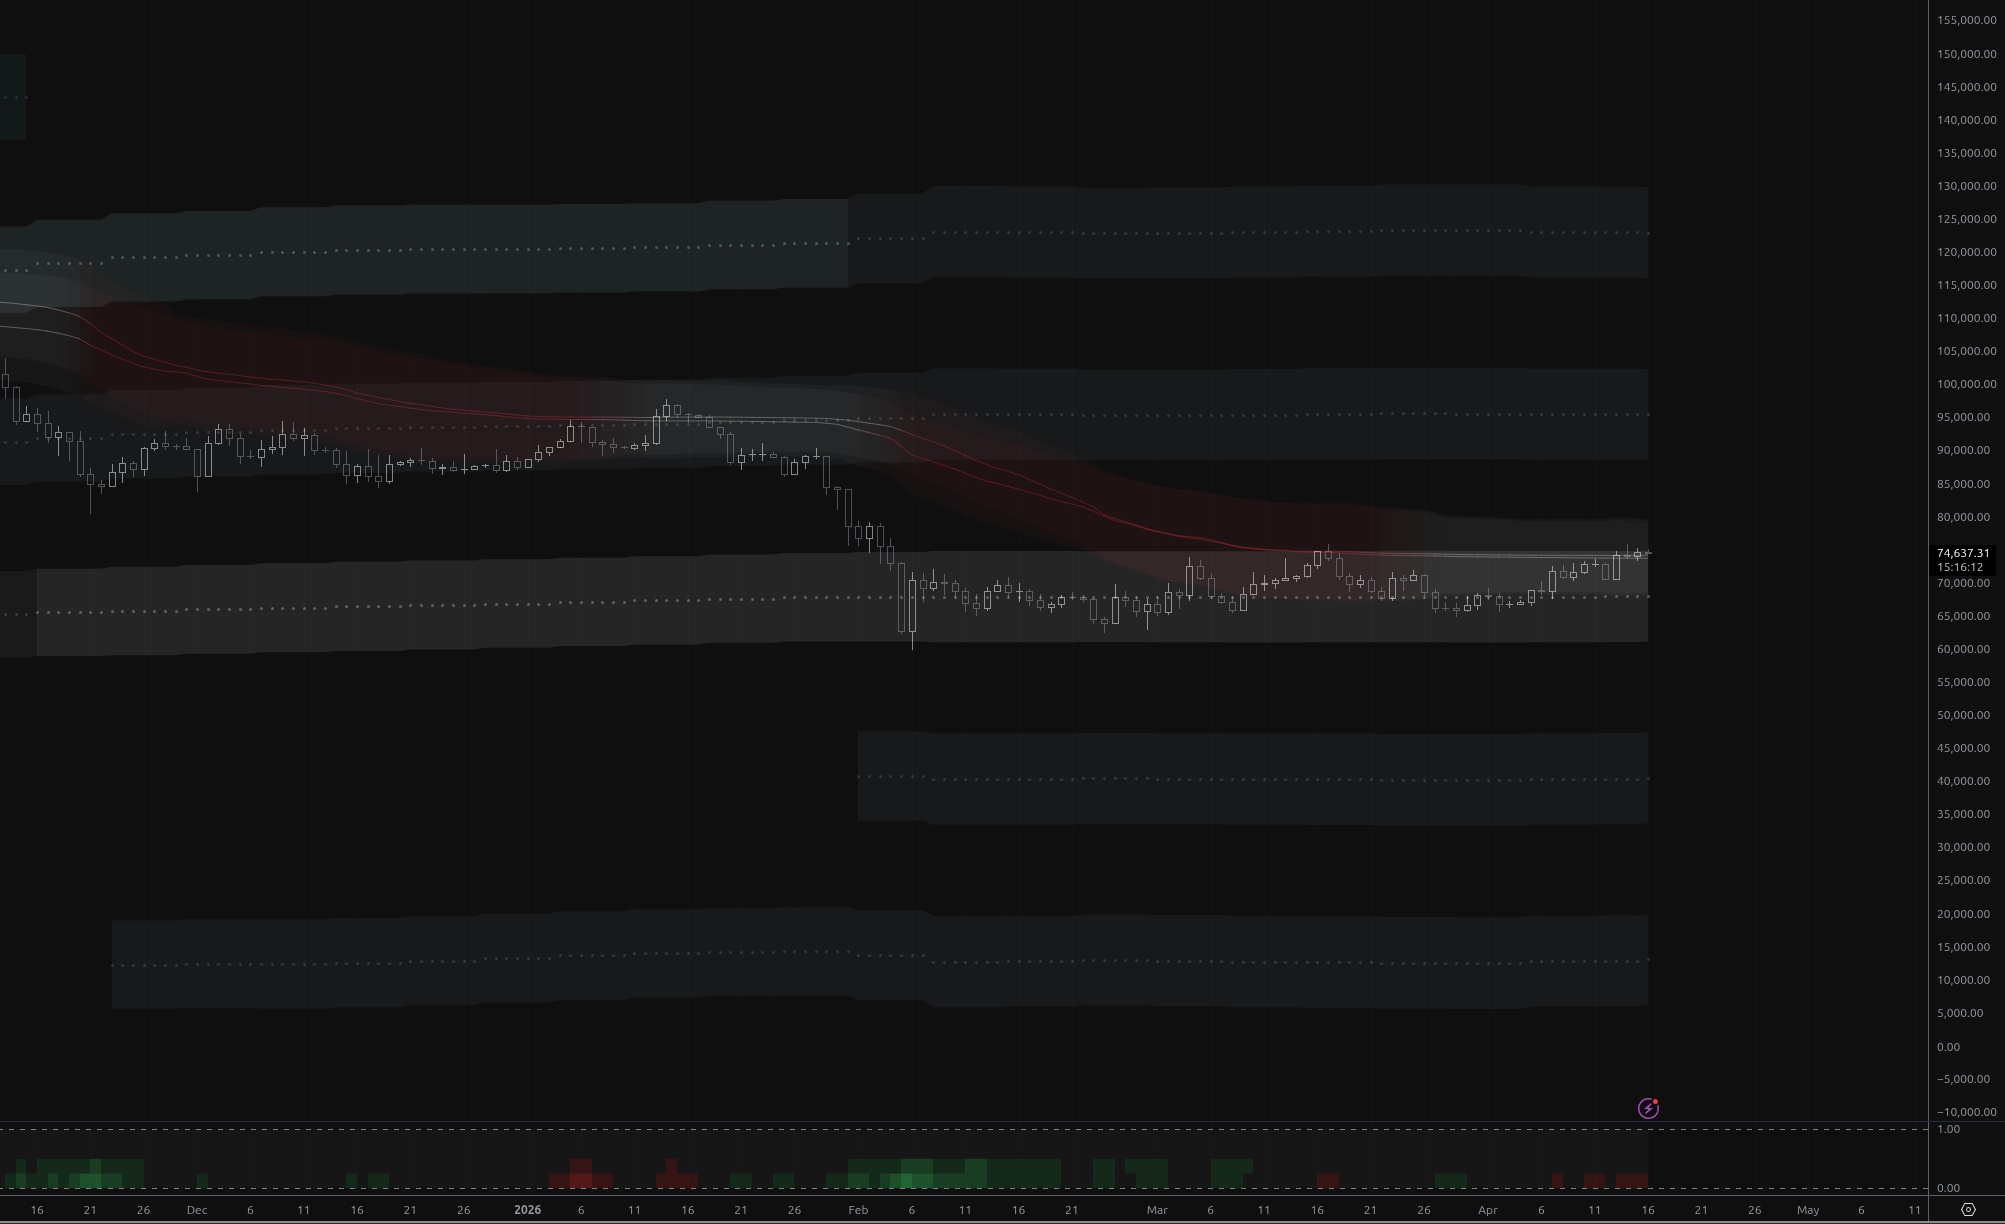
BTCUSD trying to breakout off the bottom range, targeting $89,000 area
The content on this page is for educational and informational purposes only and does not constitute financial advice. We are not licensed financial advisors or professional traders. Trading involves substantial risk of loss and is not suitable for every investor. Past performance is not indicative of future results. Always do your own research and consult a qualified financial professional before making any investment decisions.
Executive Summary
Bitcoin is trading at $74,718 on the daily timeframe, pressing against the upper boundary of the MSL base band at $75,009 after spending 70 consecutive bars within this wide structural zone. The price has staged a remarkable recovery from the $62,510 low printed roughly 50 bars ago, but now faces a critical inflection point. The regime classifier reads mild bearish with maximum confidence (1.00), while the structural state remains firmly in distribution (confidence: 1.00) — a combination that historically favors sellers at resistance. With price at the 98th percentile of the base band and volume collapsing to just 0.22x the 20-bar average, this rally is approaching a decision zone that will likely define the next major directional move.
Trend Overview: Flat AMAB in a Bearish Regime
Both AMAB moving averages have flattened after a prolonged period of strong bearish slopes. The slope change occurred 29 bars ago, marking the transition from the aggressive downtrend that drove price from the $97,000s into the $62,000s. Key observations:
- MA1 slope: 0.0383 (flat, decelerating) — the adaptive MA has stopped falling but shows no bullish conviction
- MA2 slope: 0.0596 (flat) — similarly neutral
- Price vs. bands: Price is above the upper band of both MA1 and MA2, which typically signals overextension in a flat-trend environment
- Band widths: MA1 at 7.54%, MA2 at 7.72% — relatively compressed, reflecting the consolidation phase
- Recent 20-bar split: 8 candles above MA1, 10 below MA2 — showing the choppy, range-bound nature of recent price action
The AMAB picture is one of trend exhaustion and consolidation. The prior strong bearish trend has dissipated, but no bullish trend has emerged. Price sitting above both upper bands in a flat-slope environment is a warning sign — it suggests a short-term overextension rather than the beginning of a new uptrend.
MSL Band Analysis: The Critical Base Band
Current Position
| Parameter | Value |
|---|---|
| Current Band | base |
| Band Mid | $68,142 |
| Band Low | $61,275 |
| Band High | $75,009 |
| Position in Band | 0.98 (98th percentile) |
| Time in Band | 70 bars |
| Band Width | 20.16% |
| Band Above (above_1) | $95,611 mid |
| Band Below | $40,673 mid |
Band Structure Context
The base band is the structural anchor of the entire MSL grid. At $68,142 mid with a massive 20.16% width, this band has been the dominant trading range for about 70 consecutive daily candles. The fact that price entered this band from above (last band change direction: down) 70 bars ago tells us this was a breakdown from the above_1 band, and Bitcoin has been trapped in this structural zone ever since.
The distances to adjacent bands are striking:
- Distance to above_1: 18.77% — a massive gap that represents the "air pocket" between the base band ceiling and the next structural level at ~$95,611
- Distance to band below: 36.37% — an even larger gap down to ~$40,673, representing catastrophic downside if the base band fails entirely
This asymmetry is important: the nearest structural support below the base band is extraordinarily far away, meaning a breakdown below $61,275 would enter a structural vacuum with limited support until the $40,000s.
Recent Level Tests
Price has tested the band high at $75,009 twice in the last few bars, and both tests were rejected:
- The candle 2 bars ago printed a long upper wick reaching $76,038 (above the band high) before closing at $74,132 — a classic rejection candle
- The most recent completed candle also tested the band high and was rejected, closing at $74,718
These rejections at the band ceiling are technically significant. The base band high at $75,009 is acting as a formidable resistance level, and the repeated failures to close above it suggest that sellers are defending this zone.
Historical Band-to-Band Transitions
Looking back reveals the following structural narrative:
- Price began around $88,000-$91,000 in the above_1 band, already in a strong bearish regime with distribution structural state
- A prolonged decline within the above_1 band, with price grinding from $90,000s down through the band, eventually breaking below the above_1 band low
- Price transitioned from above_1 to the base band around $88,347, marking the structural breakdown
- An extended stay in the base band featuring a dramatic crash to $62,510 (bar ~93) followed by a recovery rally back toward the band high
The crash-and-recovery pattern within the base band is particularly noteworthy. Price fell from the band high (~$75,000) all the way to near the band low (~$61,275), then staged a V-shaped recovery back to the band high. This creates a full-range test of the base band — both boundaries have been validated.
Candle Structure and Recent Price Action
The Recovery Rally
The last ~30 bars show a clear recovery pattern from the $62,510 low:
- Bars 93-108: Choppy bottoming process between $65,000-$70,000, with multiple oversold PRO readings and strong bearish regime
- Bars 108-120: Gradual base-building with higher lows forming, regime shifting from strong_bearish to mild_bearish
- Bars 120-130: Acceleration higher, with a notable large bullish candle 3 bars ago ($70,742 → $74,418)
- Bars 130-present: Testing the $75,009 band high with rejection candles
Swing Structure
The swing structure is contracting (lower highs + higher lows):
- Last swing high: $76,000 (previous: $97,924)
- Last swing low: $65,000 (previous: $62,510)
This contracting pattern forms a symmetrical triangle or pennant within the base band. The higher low at $65,000 (vs. $62,510) is constructive, but the lower high at $76,000 (vs. $97,924) confirms the broader bearish structure. The current test of $75,009 is occurring within this contracting range.
Notable Recent Candles
- 3 bars ago: Large bullish candle (+$3,676, or +5.2%) — the strongest single-day move in the recent recovery
- 2 bars ago: Long upper wick reaching $76,038 — immediate rejection after the bullish impulse, suggesting supply above $75,000
- 1 bar ago: Doji — indecision after the rejection, with a very narrow range
- Current bar: Small body near $74,718, testing band high again with extremely low volume (0.22x average)
Volume Analysis: A Critical Warning
Current volume stands at just 4,749 BTC against a full-period average of 21,935 and a recent 20-bar average of 15,962. The relative volume of 0.22x is extraordinarily low — this is the kind of volume typically seen on weekends or holidays, not during a test of major structural resistance.
The volume profile of the recovery rally tells a concerning story:
- The crash to $62,510 saw massive volume (106,299 on the capitulation candle)
- The initial bounce saw elevated volume (30,750-44,919 range)
- But volume has steadily declined as price approached the band high
- The last 4 bars show volumes of 17,373 → 9,071 → 13,472 → 24,230 → 26,533 → 10,085 → 4,749
This declining volume into resistance is a classic distribution pattern. Genuine breakouts are typically accompanied by expanding volume, not contracting volume. The current test of $75,009 on minimal volume suggests this is more likely a liquidity grab than a sustainable breakout attempt.
Regime and Structural State Context
Regime: Mild Bearish (Confidence: 1.00)
The HMM regime classifier has maintained a mild bearish reading for 23 consecutive bars with maximum confidence. This is notable because:
- The regime shifted from strong_bearish to mild bearish around bar 120, coinciding with the base-building phase
- Despite the recovery rally from $62,510 to $74,718 (+19.5%), the regime has NOT shifted to neutral or bullish
- This suggests the broader probabilistic model still sees more downside risk than upside potential
In a mild bearish regime, the playbook favors selling rallies into resistance rather than buying breakouts. New longs carry elevated risk, and the regime context argues against aggressive positioning on the long side at the band high.
Structural State: Distribution (Confidence: 1.00)
The structural classifier has been in distribution for an extraordinary 153 consecutive bars — essentially the entire visible history. Distribution describes a compressed upper range with bearish pressure, and its persistence through both the crash and recovery phases suggests that the broader market structure remains oriented toward eventual lower prices.
The combination of mild bearish regime + distribution structural state at the 98th percentile of the base band creates a high-probability setup for rejection. Historically, this confluence favors mean reversion back toward the band midpoint or lower.
PRO (Price Rejection Oscillator)
The PRO reads overbought (direction: -1) with a signal of 0.65 and intensity of 0. The signal has been in overbought territory for 3 bars and is falling. Key context:
- PRO overbought signals in a mild_bearish regime should be taken seriously as potential reversal signals
- The falling signal trend suggests the overbought condition is beginning to resolve
- However, intensity is 0, meaning the rejection signal is weak — this is not a high-conviction PRO signal
Per the indicator rules, PRO overbought signals during strong uptrends should be ignored, but this is NOT a strong uptrend — it's a counter-trend rally within a bearish regime. The PRO reading adds modest confluence to the bearish case at resistance.
Scenario Analysis
Scenario 1: Rejection at Base Band High — Return to Mid-Band (Probability: 55%)
This is the highest-probability scenario given the confluence of signals:
- Trigger: Price fails to close above $75,009 and prints a bearish reversal candle (engulfing, shooting star, or gap down)
- Path: Decline from $74,700-$75,000 back toward the base band midpoint at $68,142
- Extended target: If selling accelerates, the base band low at $61,275 comes into play
- Supporting factors: Mild bearish regime, distribution state, declining volume, double rejection at band high, contracting swing structure (lower highs), PRO overbought
- Invalidation: A decisive daily close above $76,000 (above the swing high) with expanding volume would invalidate this scenario
The base band midpoint at $68,142 represents a natural mean-reversion target — a 8.8% decline from current levels. This aligns with the band-to-band trading strategy where price oscillates between band boundaries.
Scenario 2: Breakout Above Base Band — Rally Toward Above_1 (Probability: 25%)
While less likely given current conditions, a breakout cannot be dismissed:
- Trigger: A strong daily close above $75,009 (base band high) with volume exceeding 20,000+ BTC, followed by a successful retest of $75,000 as support
- Path: Rally into the structural vacuum between base band high ($75,009) and above_1 band ($87,800-$101,162). Initial target would be the AMAB MA1 upper band around $74,542 (already breached), then the above_1 band low at $87,800
- Extended target: Above_1 band mid at $95,611 — an 18.8% move from current levels
- Supporting factors: Higher low at $65,000 vs. $62,510, AMAB slopes turning flat (no longer bearish), the large bullish candle 3 bars ago showing buying interest
- Invalidation: A failed breakout (close above $75,009 followed by immediate reversal below $73,500) would trap longs and likely accelerate the bearish scenario
The key challenge for bulls is the 18.77% gap between the base band high and the above_1 band. This is a structural desert with no intermediate support levels, meaning any breakout attempt would need sustained buying pressure to traverse this zone. The mild_bearish regime and distribution state make this unlikely without a fundamental catalyst.
Scenario 3: Extended Consolidation Within Base Band (Probability: 15%)
- Trigger: Price oscillates between $68,000-$75,000 without breaking either boundary decisively
- Path: Continued range-bound trading, potentially for weeks, as the market builds energy for the next directional move
- Supporting factors: Flat AMAB slopes, 70 bars already in the band (suggesting comfort at this level), contracting swing structure
- Resolution: Eventually resolves into Scenario 1 or 2, with the contracting triangle pattern providing the catalyst
Scenario 4: Catastrophic Breakdown Below Base Band (Probability: 5%)
- Trigger: A macro shock or cascading liquidation event drives price below the base band low at $61,275
- Path: Freefall toward the next MSL band at $40,673 — a 36.4% decline from current levels
- Context: The previous crash to $62,510 already tested near the band low. A second test that breaks through would be extremely bearish
- Invalidation: This scenario requires a significant external catalyst; organic price action is unlikely to produce this outcome in the near term
Key Levels Summary
| Level | Price | Significance |
|---|---|---|
| Above_1 Band Mid | $95,611 | Major resistance — breakout target (distant) |
| Above_1 Band Low | $87,800 | First structural resistance above base band |
| Recent Swing High | $76,000 | Immediate resistance — breakout confirmation level |
| Base Band High | $75,009 | Critical resistance — current test zone |
| AMAB MA1 Upper | $74,542 | Dynamic resistance (currently breached) |
| Base Band Mid | $68,142 | Mean reversion target — natural pullback level |
| Recent Swing Low | $65,000 | Key support — higher low in contracting structure |
| Base Band Low | $61,275 | Critical support — breakdown level |
| Band Below | $40,673 | Catastrophic support — structural floor |
Conclusion
Bitcoin finds itself at a pivotal juncture. The recovery from $62,510 to $74,718 has been impressive in magnitude (+19.5%) but is now confronting the full weight of structural resistance at the base band high ($75,009). Every contextual indicator — regime (mild_bearish), structural state (distribution), volume (collapsing), PRO (overbought), and AMAB (flat with price overextended above bands) — argues for caution at these levels.
The most probable near-term outcome is a rejection and pullback toward the $68,000-$70,000 zone (base band midpoint area). A genuine breakout above $75,009 would require a significant shift in market character — expanding volume, regime transition toward neutral/bullish, and structural state evolution away from distribution. Until those conditions materialize, the weight of evidence favors treating this rally as a counter-trend move within a broader bearish structure rather than the beginning of a new bull phase.
The contracting swing structure (lower highs at $76,000 vs. $97,924; higher lows at $65,000 vs. $62,510) suggests that a resolution is approaching. The direction of the eventual breakout from this compression will likely define Bitcoin's trajectory for the next several months. For now, the base band high at $75,009 remains the line in the sand.
Featured Indicators
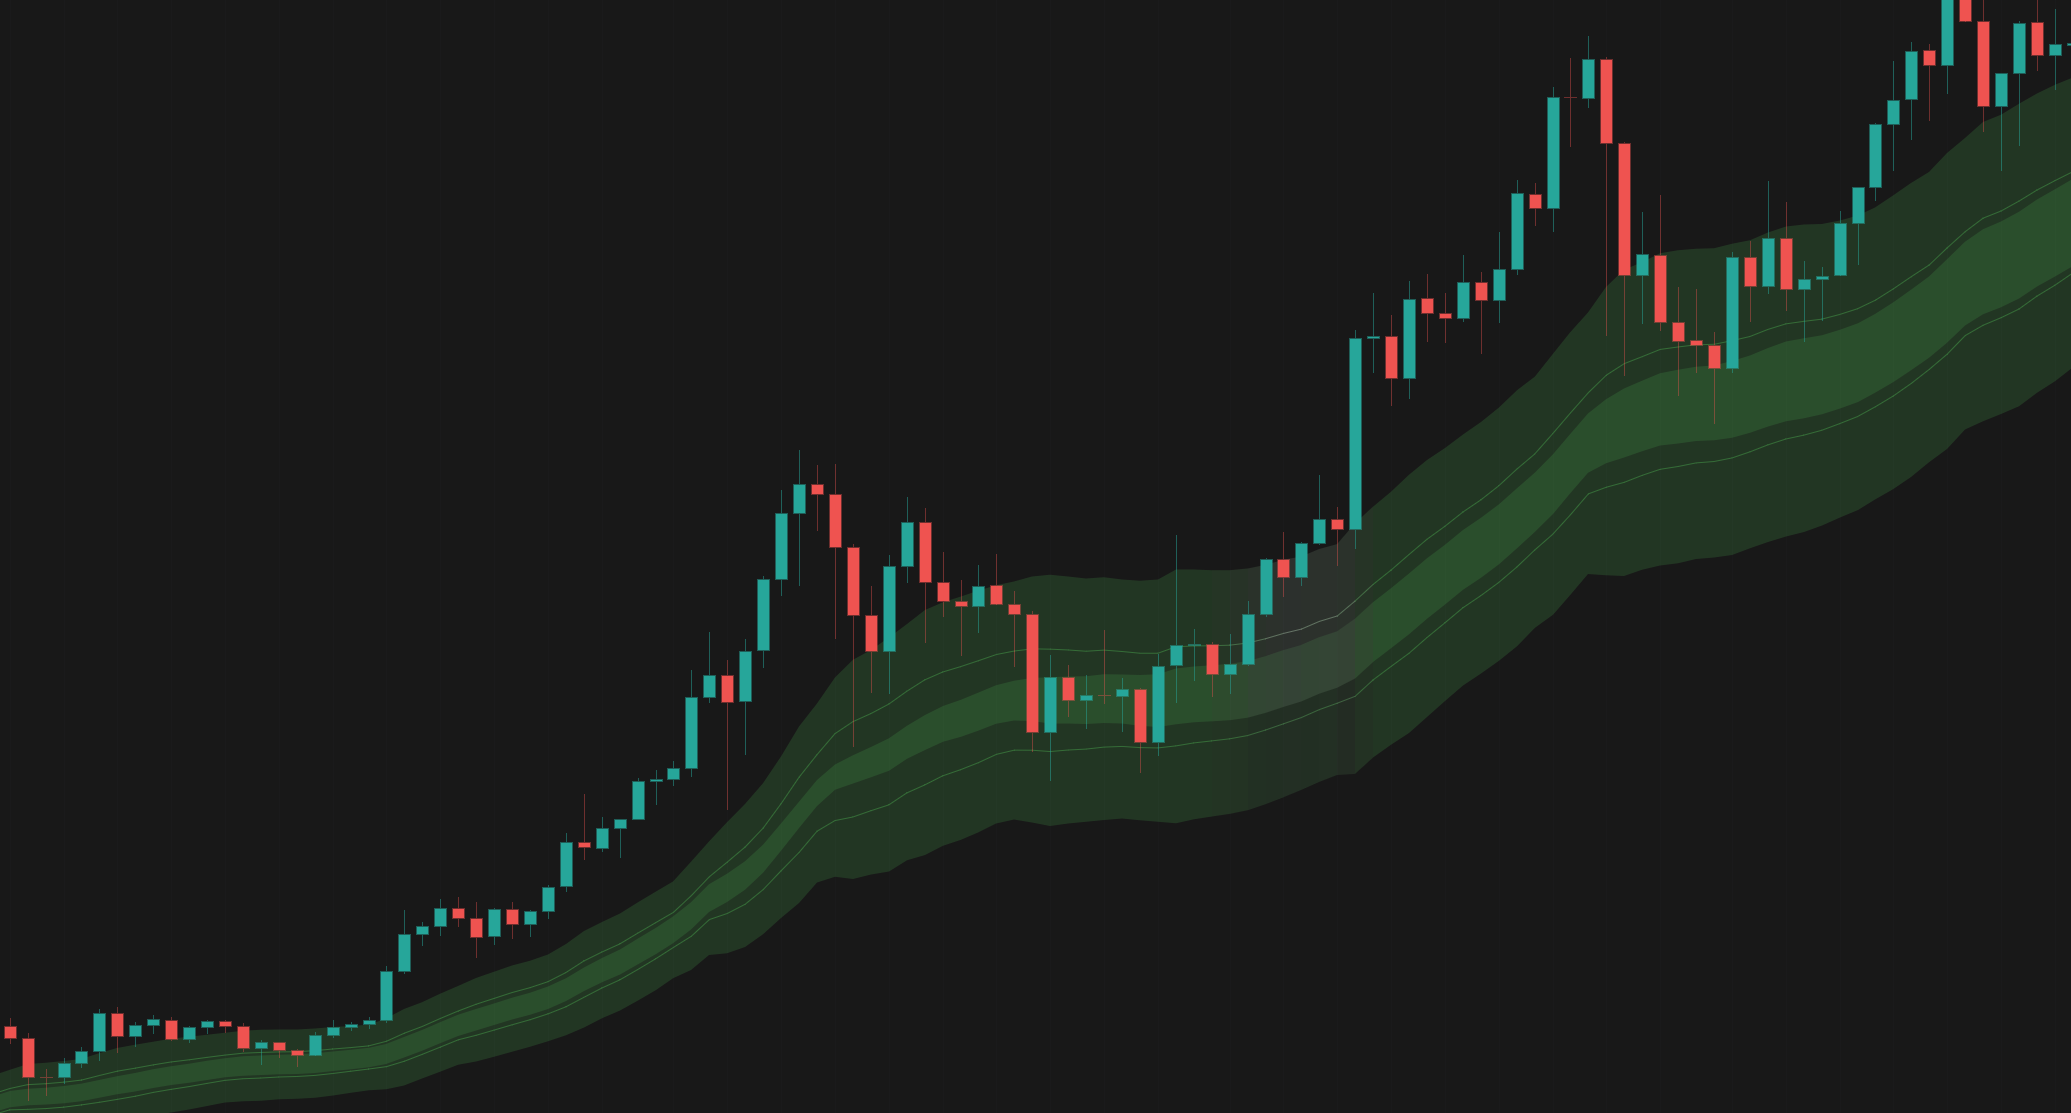
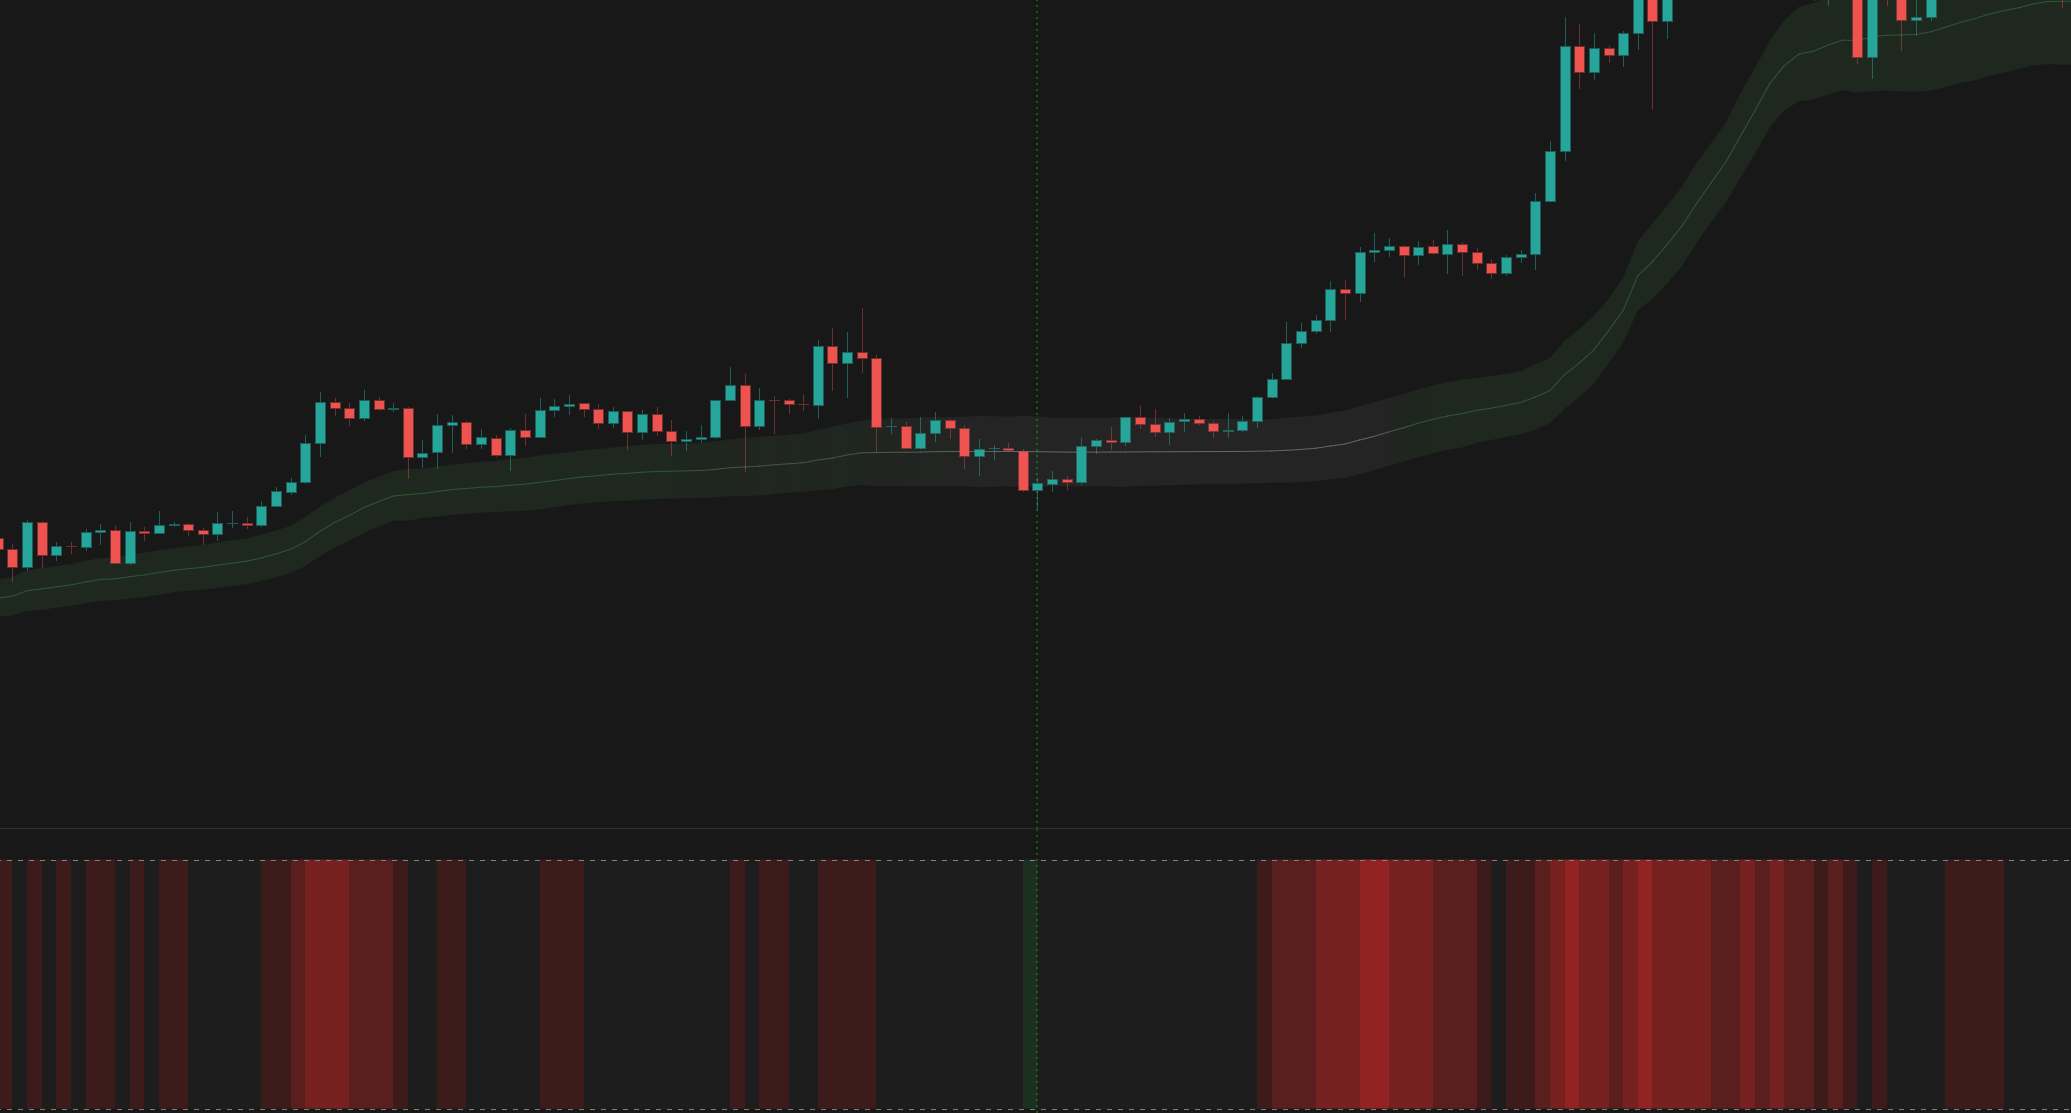
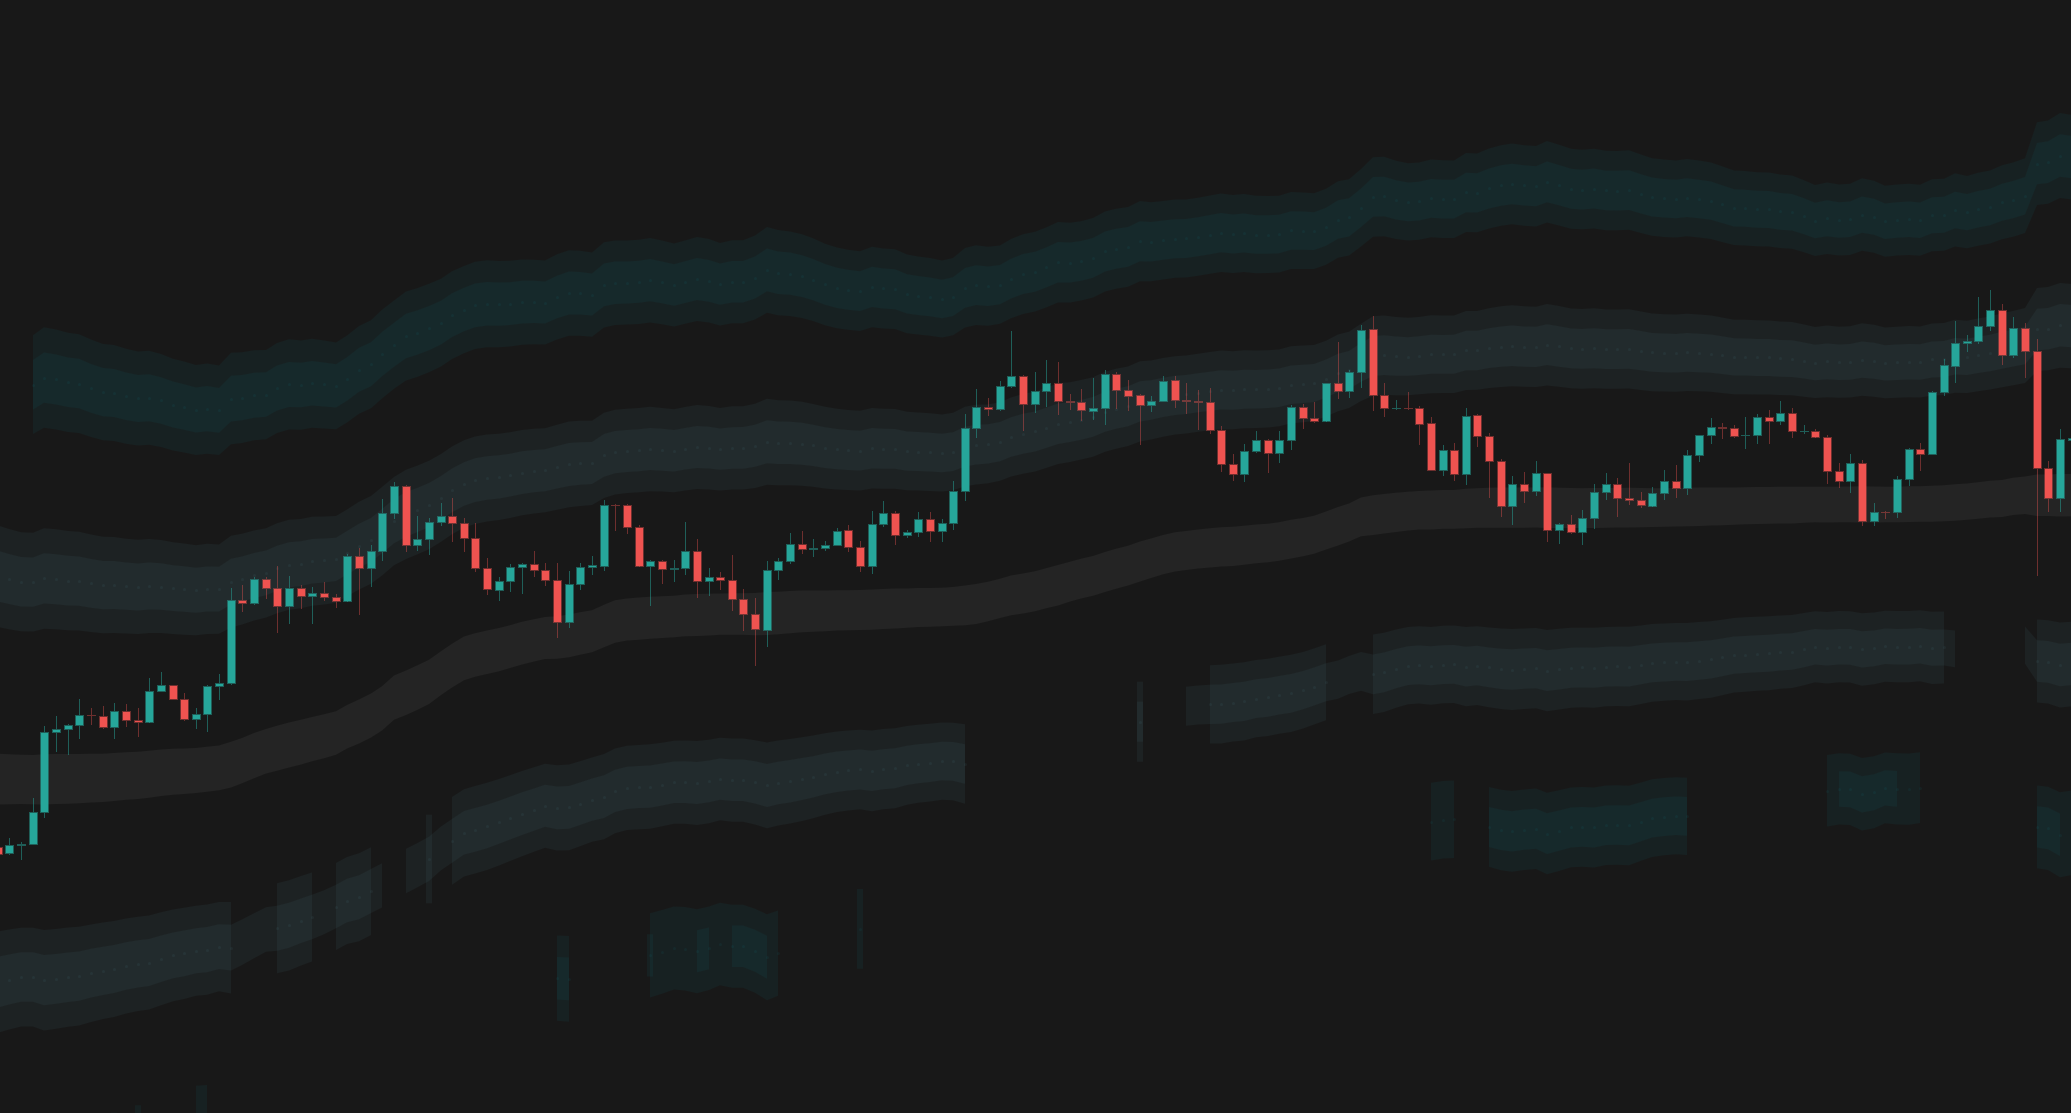
The indicators referenced in this trading idea.
Related Ideas
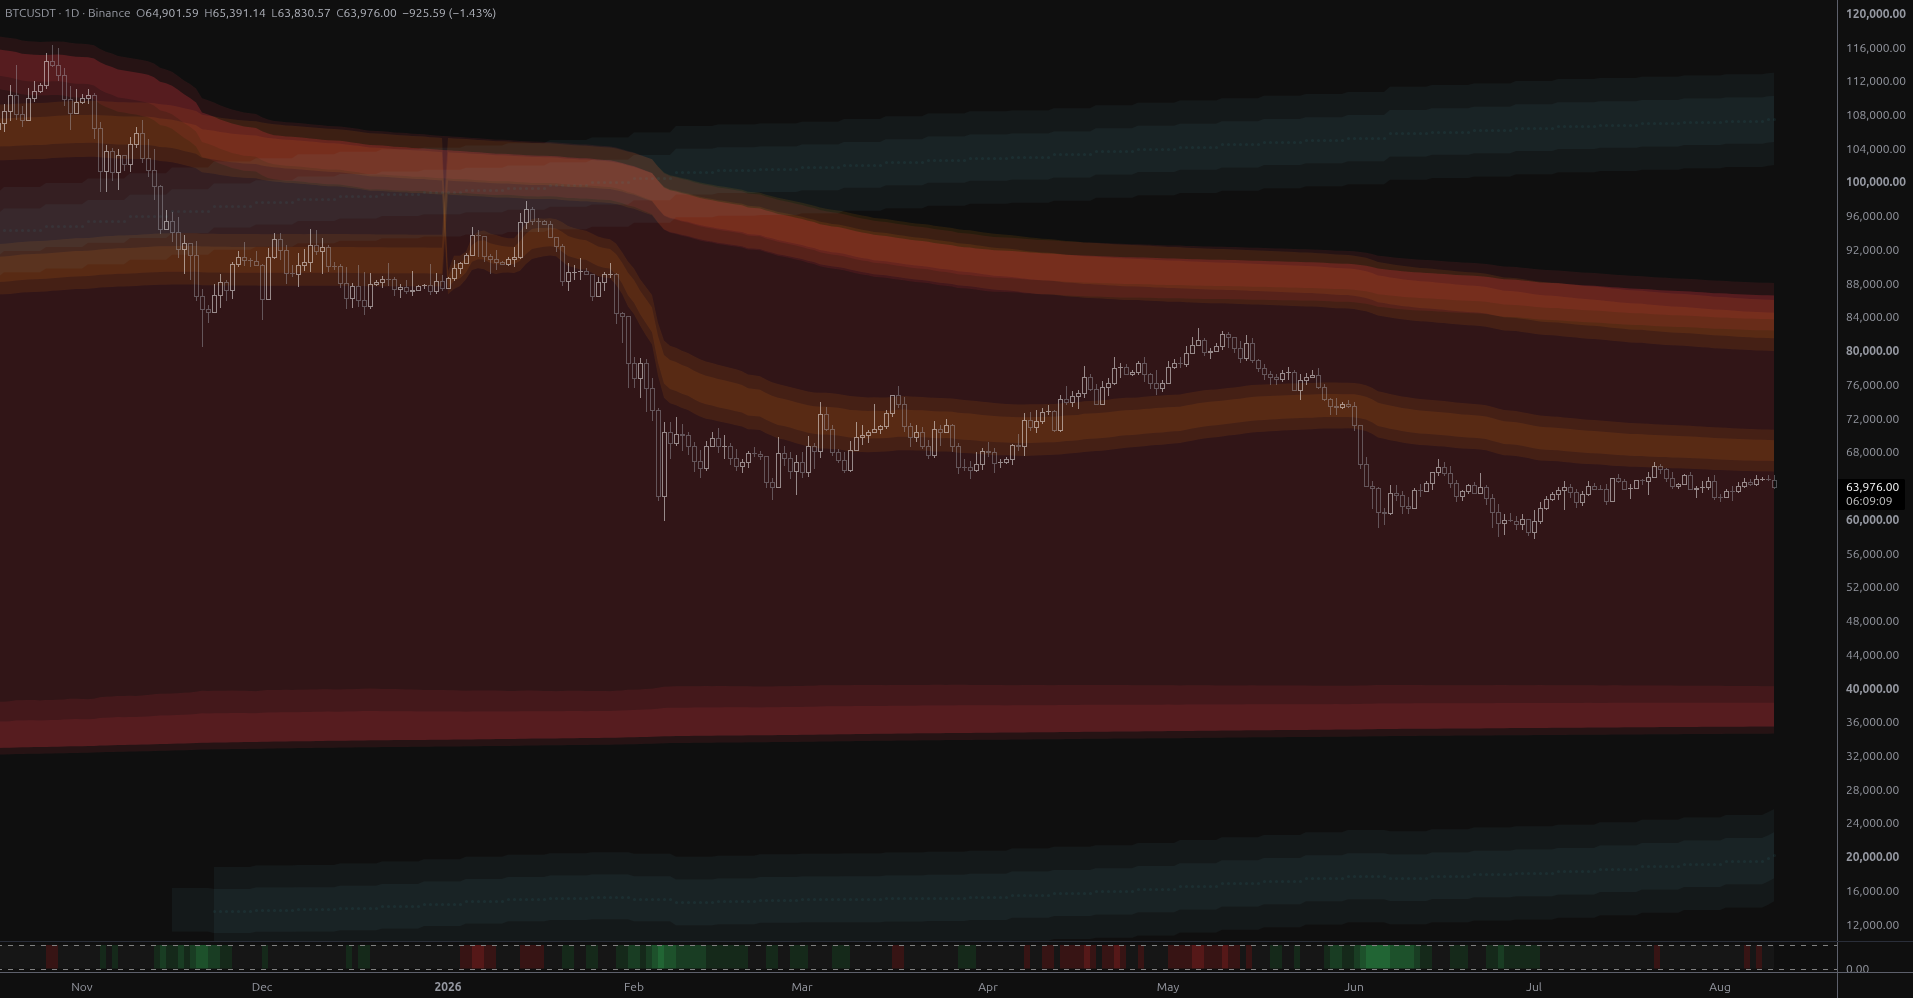
BTC Coils Just Under Its Yearly Value Rail
Bitcoin is coiling at $64,901 just 1.8% below its year-anchored value rail at $66,048, with structural bands far away in both directions. Ranked scenarios, key levels and the air pocket below $57,800.
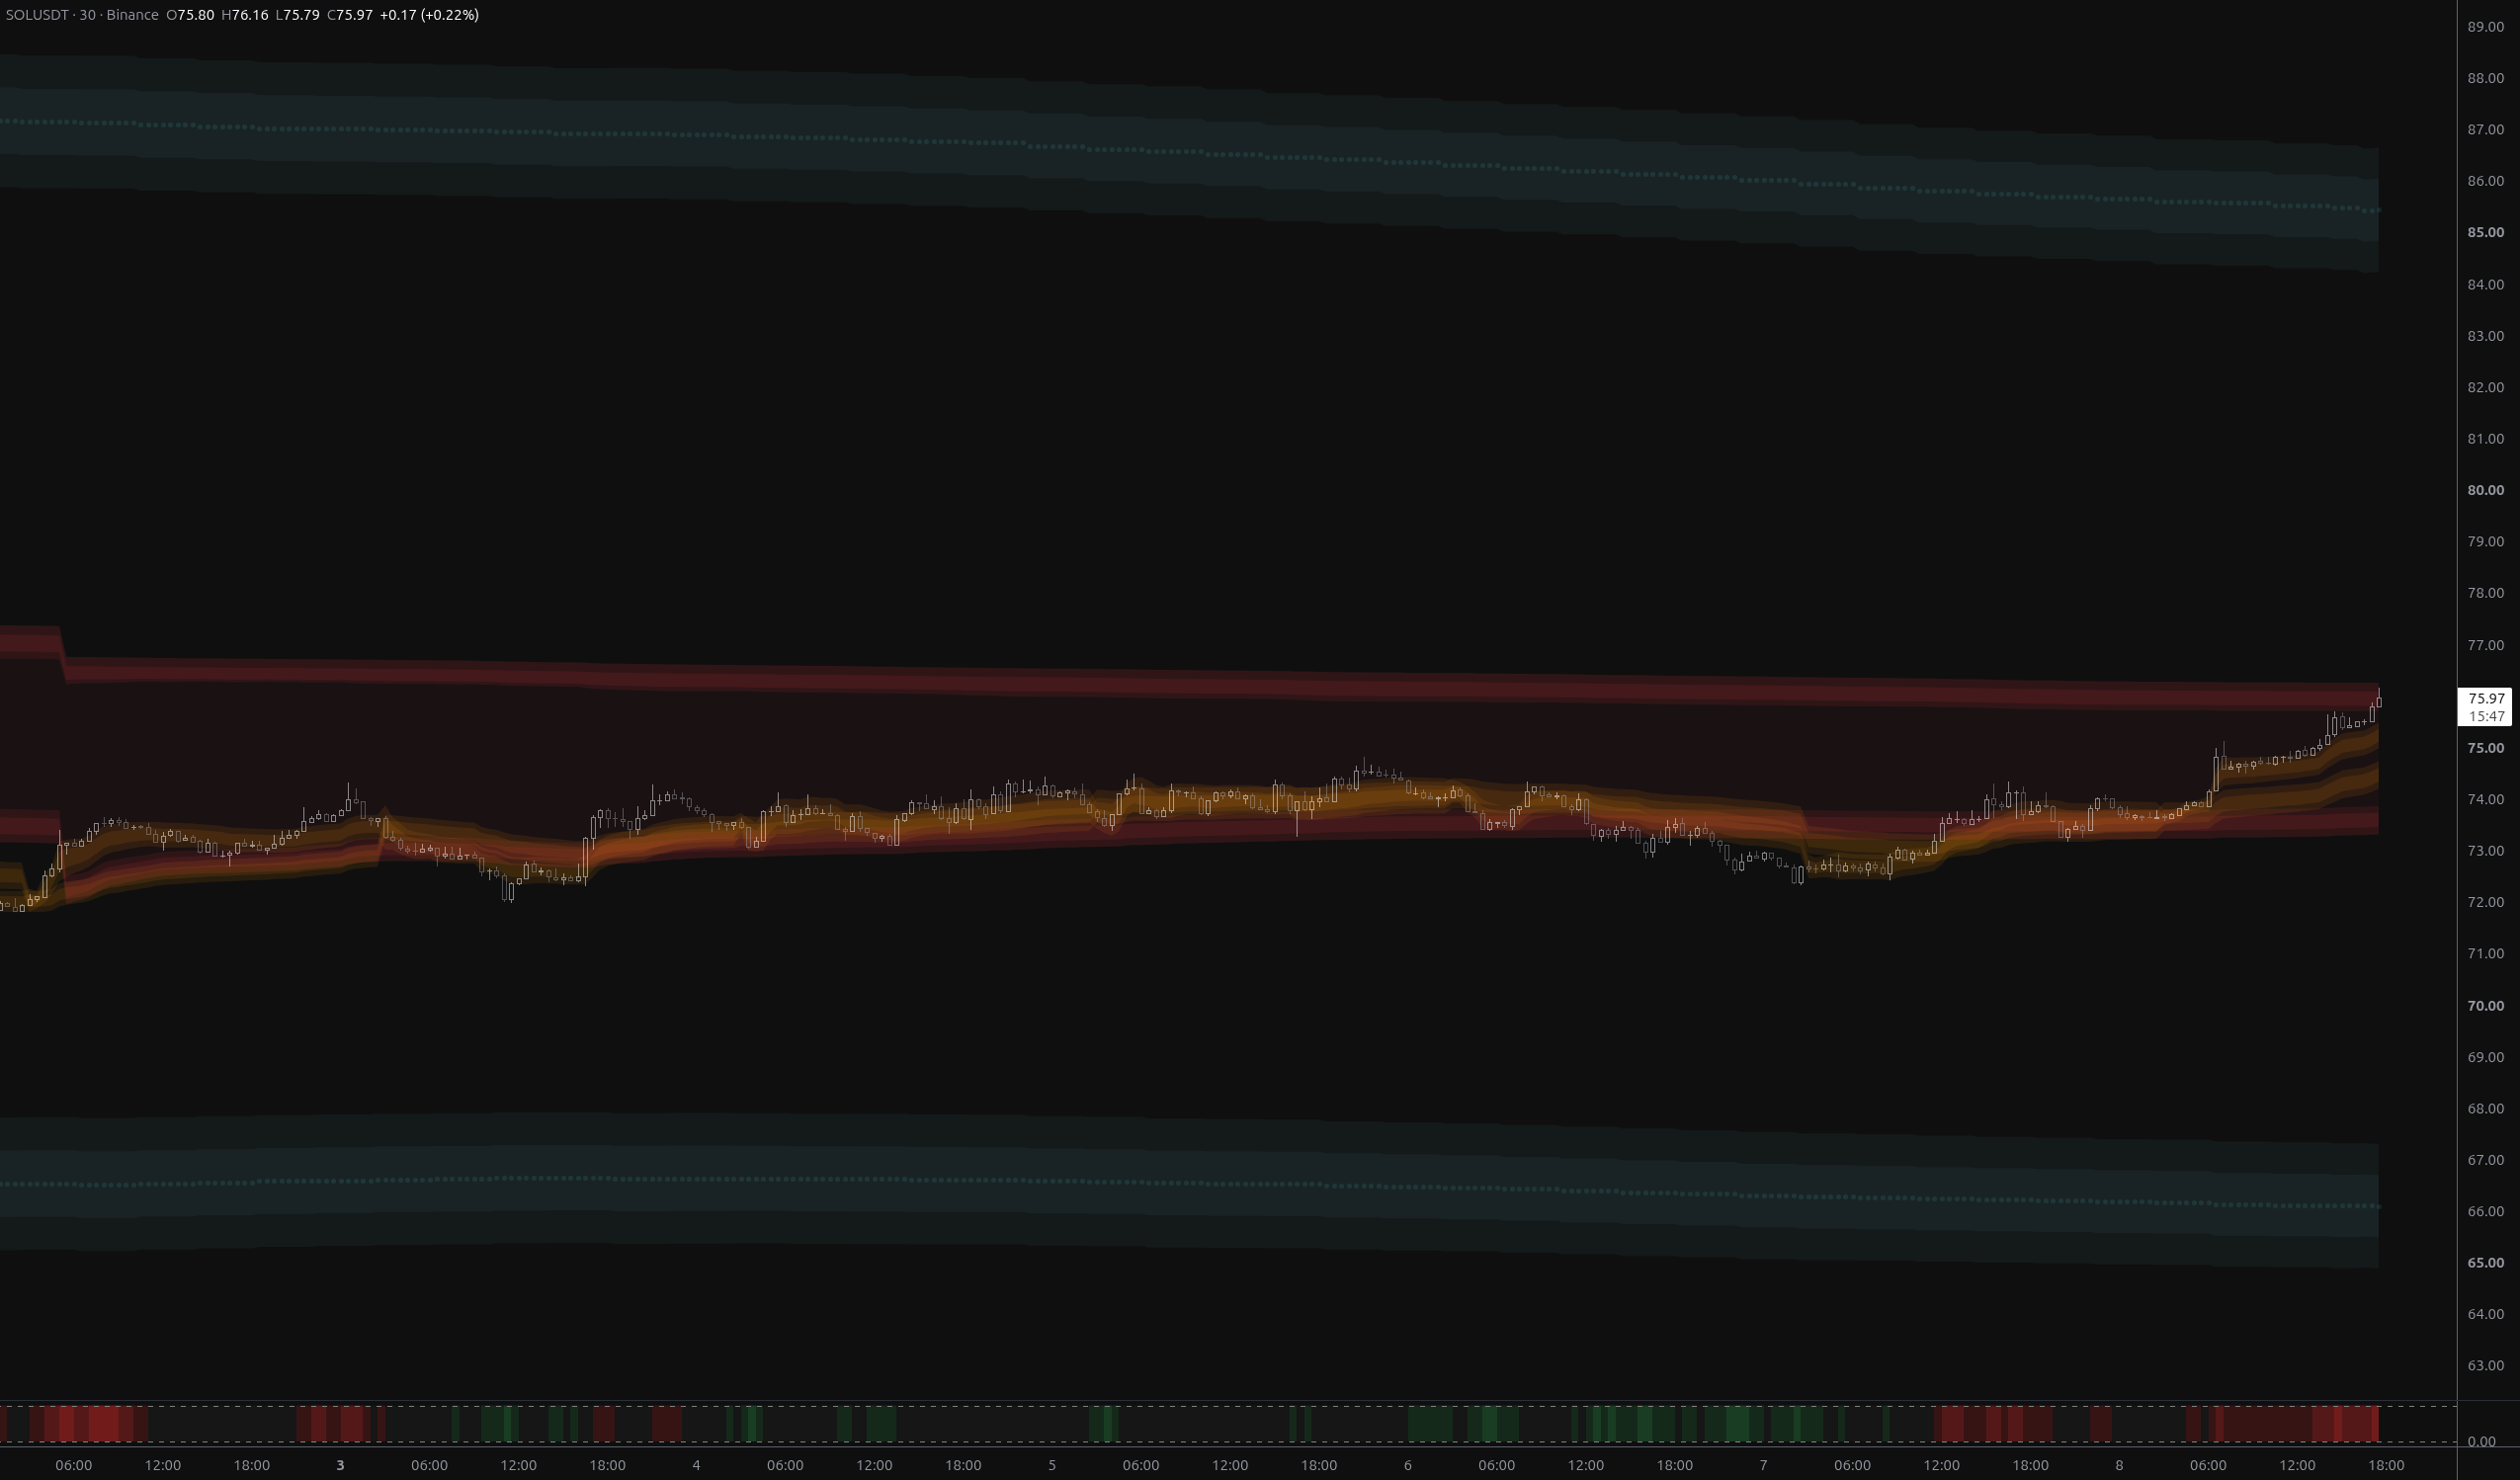
SOLUSDT: Bears Invalidated, $76.27 Now the Test
SOLUSDT has fully reversed the breakdown, reclaiming both fair-value envelopes and flipping its nearest structural band to above_1. The $75.73–$76.27 rail zone is now the decisive test.
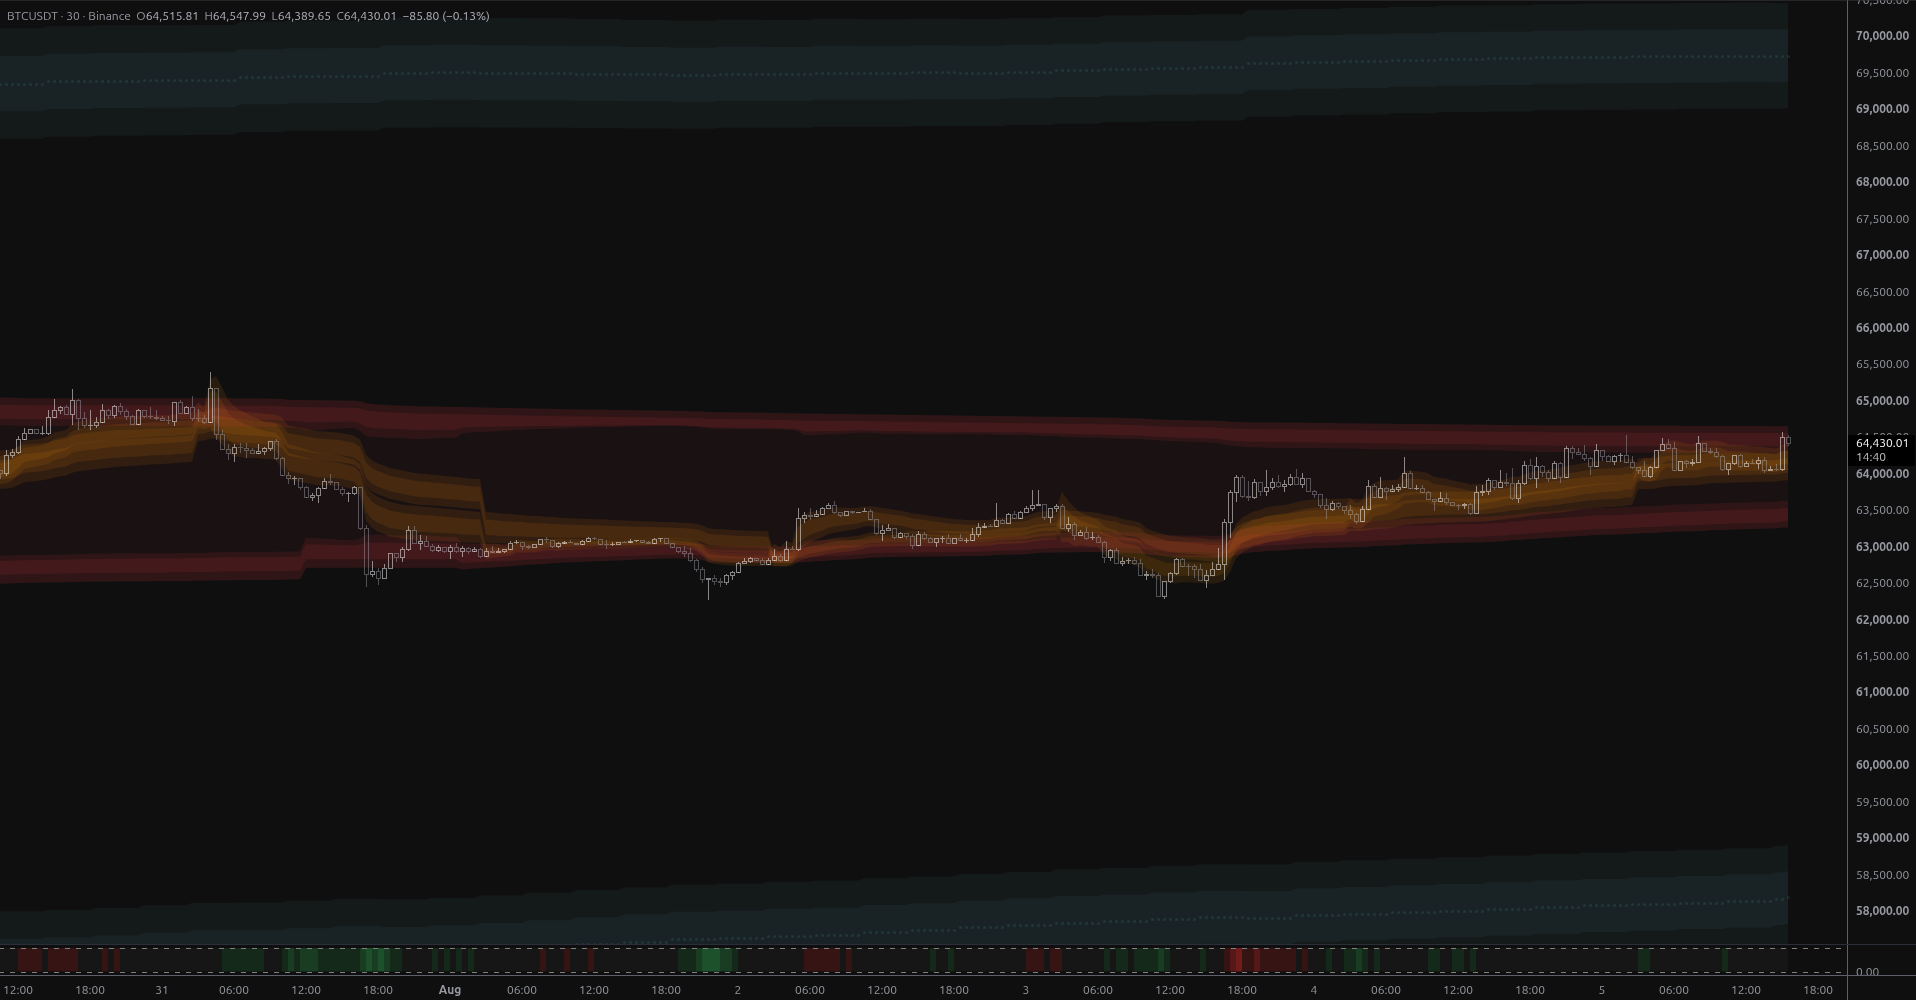
BTCUSDT: Breakout Into Open Structural Air
BTCUSDT broke above week-scale anchored value on 2.7x volume, leaving it stranded in structural open air with the nearest MSL band 6.8% overhead at $68,925 and no support until $59,012.
Connect With Us
Join our community of traders and stay updated with our latest tools and market insights.