Anchored VWAP
Channels.
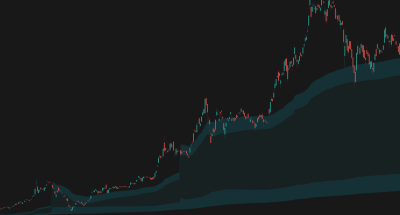
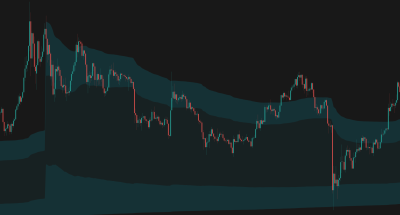
Anchored VWAP Channels that dynamically track volume-weighted average price from significant pivots or time periods, complete with volatility bands and historical levels.

Price riding on top of AVWAPs range - TSLA, 1D
Overview
The Problem
Traditional VWAP resets daily, missing the broader context of significant market events or structural pivots. Traders often struggle to find dynamic support and resistance levels that account for both volume and volatility from key turning points.
The Solution
Anchored VWAP Channels allows anchoring to specific timeframes or automatic market pivots. It wraps the VWAP in ATR-based volatility bands and can display up to 15 historical levels, creating a comprehensive map of market structure and value zones.
Who It's For
Day traders, swing traders, and volume-profile enthusiasts looking for dynamic, volume-backed support and resistance levels.
Key Features
Multiple Anchor Options: Anchor to time periods (Session, Week, Month, etc.), Auto-detect based on timeframe, or anchor to structural Market Pivots.
VWAP & EVWAP Support: Choose between traditional Volume-Weighted Average Price or Exponential VWAP for different weighting characteristics.
Historical Levels: Display up to 15 previous anchored VWAP levels to visualize historical value zones and market memory.
Blended Envelope: Create a master channel (Hollow or Solid) that encompasses all active historical levels, highlighting the broader market value area.
Dynamic Volatility Bands: Channels are built using ATR multipliers, adapting to current market volatility.
How It Works
Anchoring Mechanism
The indicator resets its volume and price calculations at the start of each chosen period or when a new structural pivot (High/Low) is detected.
Volatility Bands
The upper and lower channel bands are calculated using the Average True Range (ATR) multiplied by the Channel Height Factor, providing dynamic boundaries.
Historical Tracking
When a new anchor period starts, the previous VWAP level is saved and continues to be plotted, creating a historical map of previous value areas.
How To Use
Quickstart
- Add Anchored VWAP Channels to your chart.
- Select your preferred Anchor Period (e.g., 'Pivot' for structural levels or 'Session' for day trading).
- Adjust the Channel Height Factor to fit the current market volatility.
- Enable 'Previous Anchored VWAPs' to see historical value zones.
Interpretation
- Price above the current VWAP indicates bullish control from the anchor point; below indicates bearish control.
- The upper and lower bands act as dynamic support and resistance. Reversals often occur at these boundaries.
- Historical VWAP levels often act as strong magnets or support/resistance zones when price returns to them.
- The Blended Envelope shows the macro value area. Breakouts from the blended envelope can signal significant trend shifts.
Visual Legend
| Element | Meaning | Interpretation | Common Mistake |
|---|---|---|---|
| Midline | Anchored VWAP — the volume-weighted average price since the anchor point. | Dynamic trend center; price gravitates toward it. | Treating it as a hard wall; it's a dynamic zone. |
| Bands | Volatility Envelope — dynamic Support/Resistance based on ATR. | Entries near bands offer better risk/reward. | Assuming price must reverse exactly at the band edge. |
| Historical Channels | Previous VWAP levels — historical value zones. | Use as secondary support/resistance or targets. | Ignoring them when price is trending strongly. |
| Blended Envelope | Macro Channel — the combined area of all active historical levels. | Shows the broader market value area. | Trading inside the envelope without considering the current active channel. |
Settings Reference
Main
Advanced
Style
Alert Types
Price Entered Current Band
Triggered when price enters the current fan band.
Price Broke Above Current Band
Triggered when price breaks above the current fan.
Price Broke Below Current Band
Triggered when price breaks below the current fan.
Price Entered Blended Envelope
Triggered when price enters the blended envelope.
Price Exited Blended Envelope
Triggered when price exits the blended envelope.
New Period Started
Triggered when a new Anchored Fan period starts.
Frequently Asked Questions
No, the indicator does not repaint. However, when using 'Pivot' anchoring, a pivot is only confirmed after a certain number of bars, so the anchor point may appear a few bars after the actual high/low.
Exponential Volume-Weighted Average Price applies exponential smoothing to the volume and price data, making it more responsive to recent price action compared to traditional VWAP.
Auto Anchor selects the most appropriate time-based anchor depending on your current chart timeframe (e.g., Session for <= 15m, Week for 1H, Month for Daily).
Related Indicators
Other indicators that complement Anchored VWAP Channels.
Anchored VWAP Heatmap
A powerful volume-at-price visualization tool that anchors VWAP to significant market events and displays historical volume density as a heatmap.
Supply/Demand Zones
Automatically identifies high-probability Supply and Demand zones using advanced volume calculations and price action pattern recognition.
Market Structure Levels
Dynamic support and resistance levels that automatically adapt to market volatility and price action, providing a structured grid for trading.
Connect With Us
Join our community of traders and stay updated with our latest tools and market insights.