Adaptive MA
Bands.
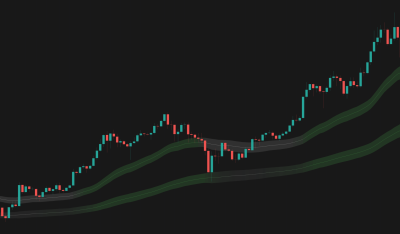
Advanced moving average algorithms that automatically adjust to market volatility, filtering out noise in choppy markets while capturing trends early.

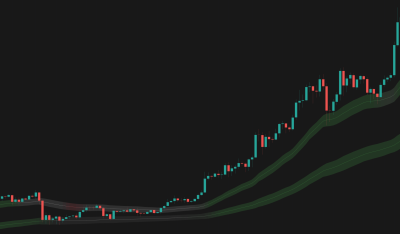
Trend reversal detection - BTCUSD, 1D
Overview
The Problem
Standard moving averages (SMA, EMA) struggle with the "lag vs. noise" dilemma. Make them fast, and you get whipsawed in chop. Make them slow, and you miss the trend entry. They treat every price movement the same, regardless of market efficiency.
The Solution
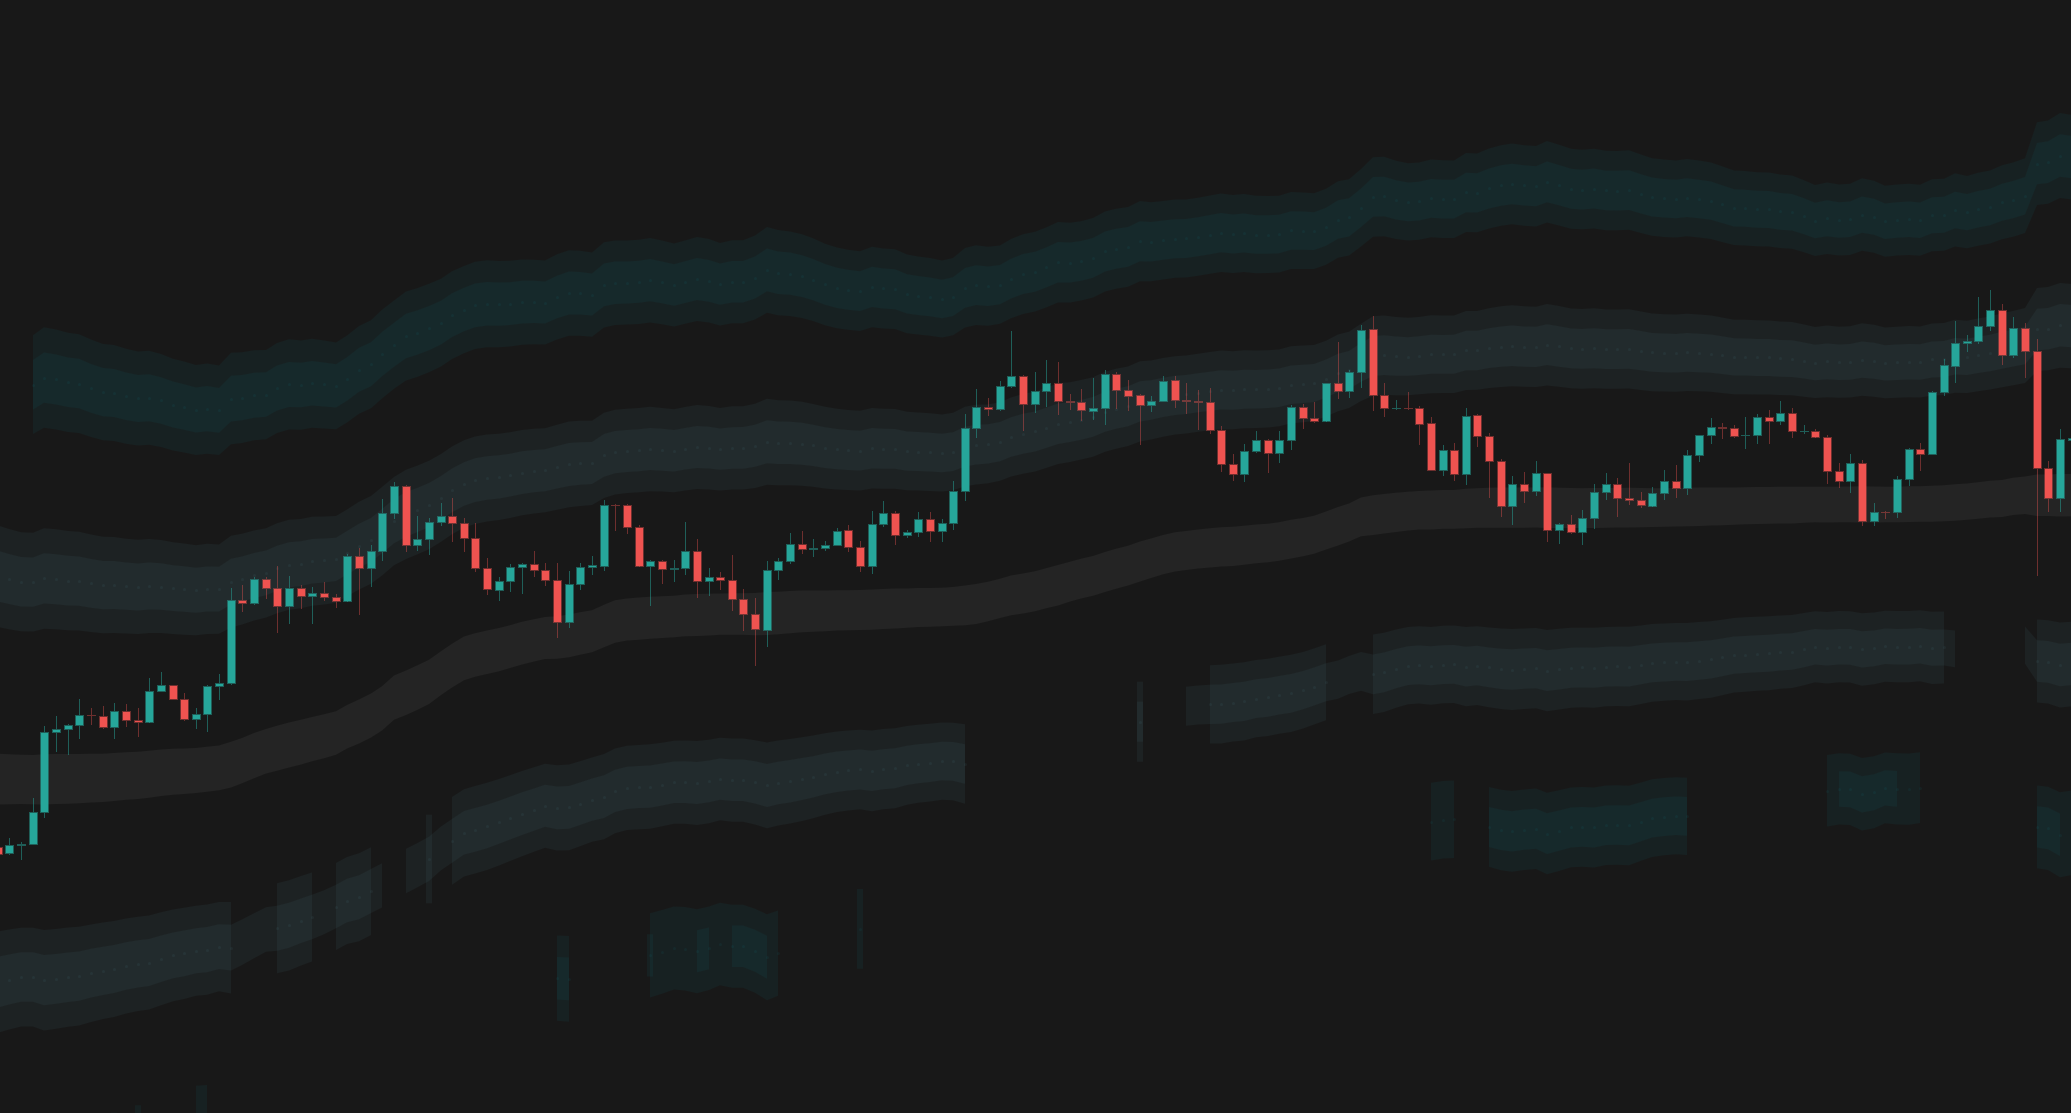
Adaptive MA Bands solves this by using advanced algorithms that adjust their smoothing based on market volatility. The indicator automatically becomes "slower" in chop to avoid fake-outs and "faster" in trends to capture moves early. It wraps this logic in volatility bands to provide dynamic Support & Resistance zones.
Who It's For
Trend traders, swing traders, and systems needing a dynamic baseline that respects market structure.
Key Features
4 Adaptive Moving Average Types: Select from KAMA, VIDYA, FRAMA, or Kalman Filter to suit your smoothing preference.
Dynamic Volatility Bands: Dynamic band width offers organic stop-loss levels and take-profit targets.
Smart Slope Coloring: Identify at a glance if momentum is accelerating, decelerating, or flat.
Dual MA Configuration: Run two independent adaptive MAs (e.g., Fast & Slow or High & Low) to create a trend-filter system with exact Stop Loss levels.
Theme Awareness: Pre-built styling for Light and Dark modes.
How It Works
Adaptive Smoothing
Traditional MAs use a fixed time window. Adaptive MAs monitor market efficiency (Price direction vs. Volatility). If price is moving efficiently in one direction, the MA speeds up. If price is oscillating (noise), the MA slows down to remain flat.
Volatility Normalization
The bands are calculated dynamically using volatility measurements. This ensures the channel width adapts to the current market "temperature"—narrowing during accumulation and widening during expansion.
Volatility-Adjusted Slope
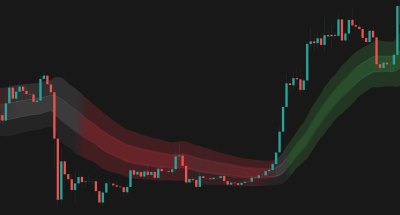
The slope coloring calculates price change relative to current volatility. This means the trend intensity (Green/Red vs Orange) is normalized against current market volatility, preventing false trend signals in highly volatile chop.
How To Use
Quickstart
- Add Adaptive MA Bands to your chart.
- Select the Dark or Light theme based on your background.
- Set MA 1 to a faster length (e.g., 10 KAMA) for entries.
- Set MA 2 to a slower length (e.g., 50 Kalman) for trend direction.
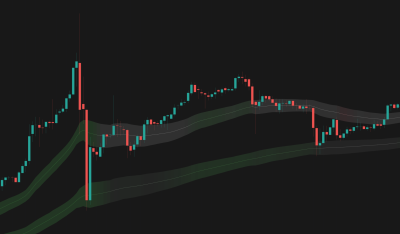
- Watch the Slope Color of MA 2 to define your bias (Green = Longs only, Red = Shorts only).
Interpretation
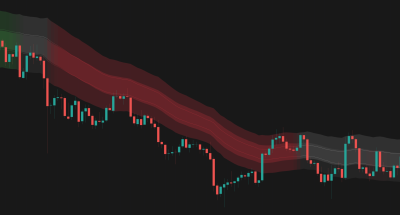
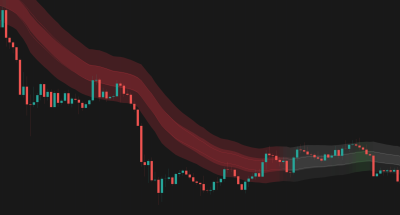
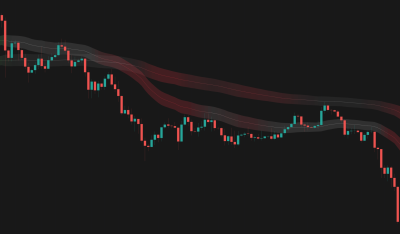
- If MA Slope is Flat (Orange): the market is directionless. Treat bands as range boundaries (fade the edges) or wait for a breakout.
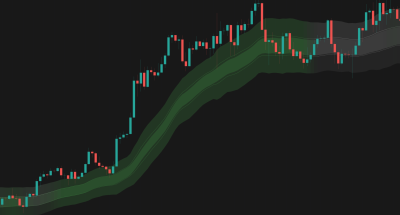
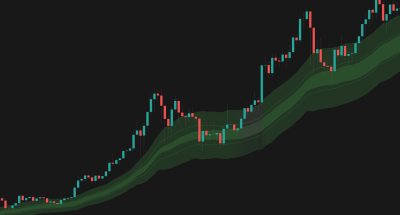
- If MA Slope is Steep (Green/Red): a strong trend is in play. Treat the touches of the midline or inner band as value entries.
- If Price Crosses MA: this often signals a regime change. A crossover of the Fast MA over the Slow MA is a classic trend initiation signal.
Visual Legend
| Element | Meaning | Interpretation | Common Mistake |
|---|---|---|---|
| Midline | Adaptive Average — the "Fair Value" of the current trend. | Dynamic trend center; price gravitates toward it. | Treating it as a hard wall; it's a dynamic zone. |
| Bands | Volatility Envelope — dynamic Support/Resistance. | Entries near bands offer better risk/reward. | Assuming price must reverse exactly at the band edge. |
| Fill Color | Slope Intensity — Green/Red = Trend, Orange = Chop. | Use color to confirm directional bias. | Trading the color change instantly without waiting for candle close. |
Settings Reference
Style
MA 1 / MA 2: Main
MA 1 / MA 2: Kalman
MA 1 / MA 2: KAMA
MA 1 / MA 2: Slope
MA 1 / MA 2: Display
MA 1 / MA 2: Style
Alert Types
Price Entered MA 1 Band
Triggered when price enters the MA 1 volatility band from above or below.
Price Entered MA 2 Band
Triggered when price enters the MA 2 volatility band from above or below.
Price Broke Above MA 1
Triggered when price crosses above the MA 1 upper band.
Price Broke Below MA 1
Triggered when price crosses below the MA 1 lower band.
Price Broke Above MA 2
Triggered when price crosses above the MA 2 upper band.
Price Broke Below MA 2
Triggered when price crosses below the MA 2 lower band.
MA 1 Crossed Above MA 2
Triggered when the MA 1 midline crosses above the MA 2 midline (bullish).
MA 1 Crossed Below MA 2
Triggered when the MA 1 midline crosses below the MA 2 midline (bearish).
Frequently Asked Questions
No. Adaptive MA Bands, regardless of selected MA type or any other options, does not repaint historical candles.
It works on all, but lower timeframes (1m-5m) usually require higher Length settings to filter noise compared to 4H or Daily charts.
The bands are built by calculating volatility over the MA length, smoothed using the selected MA method, and then multiplied by the 'Band Height Factor'.
Related Indicators
Other indicators that complement Adaptive MA Bands.
Connect With Us
Join our community of traders and stay updated with our latest tools and market insights.