
SOLUSDT: Bears Invalidated, $76.27 Now the Test
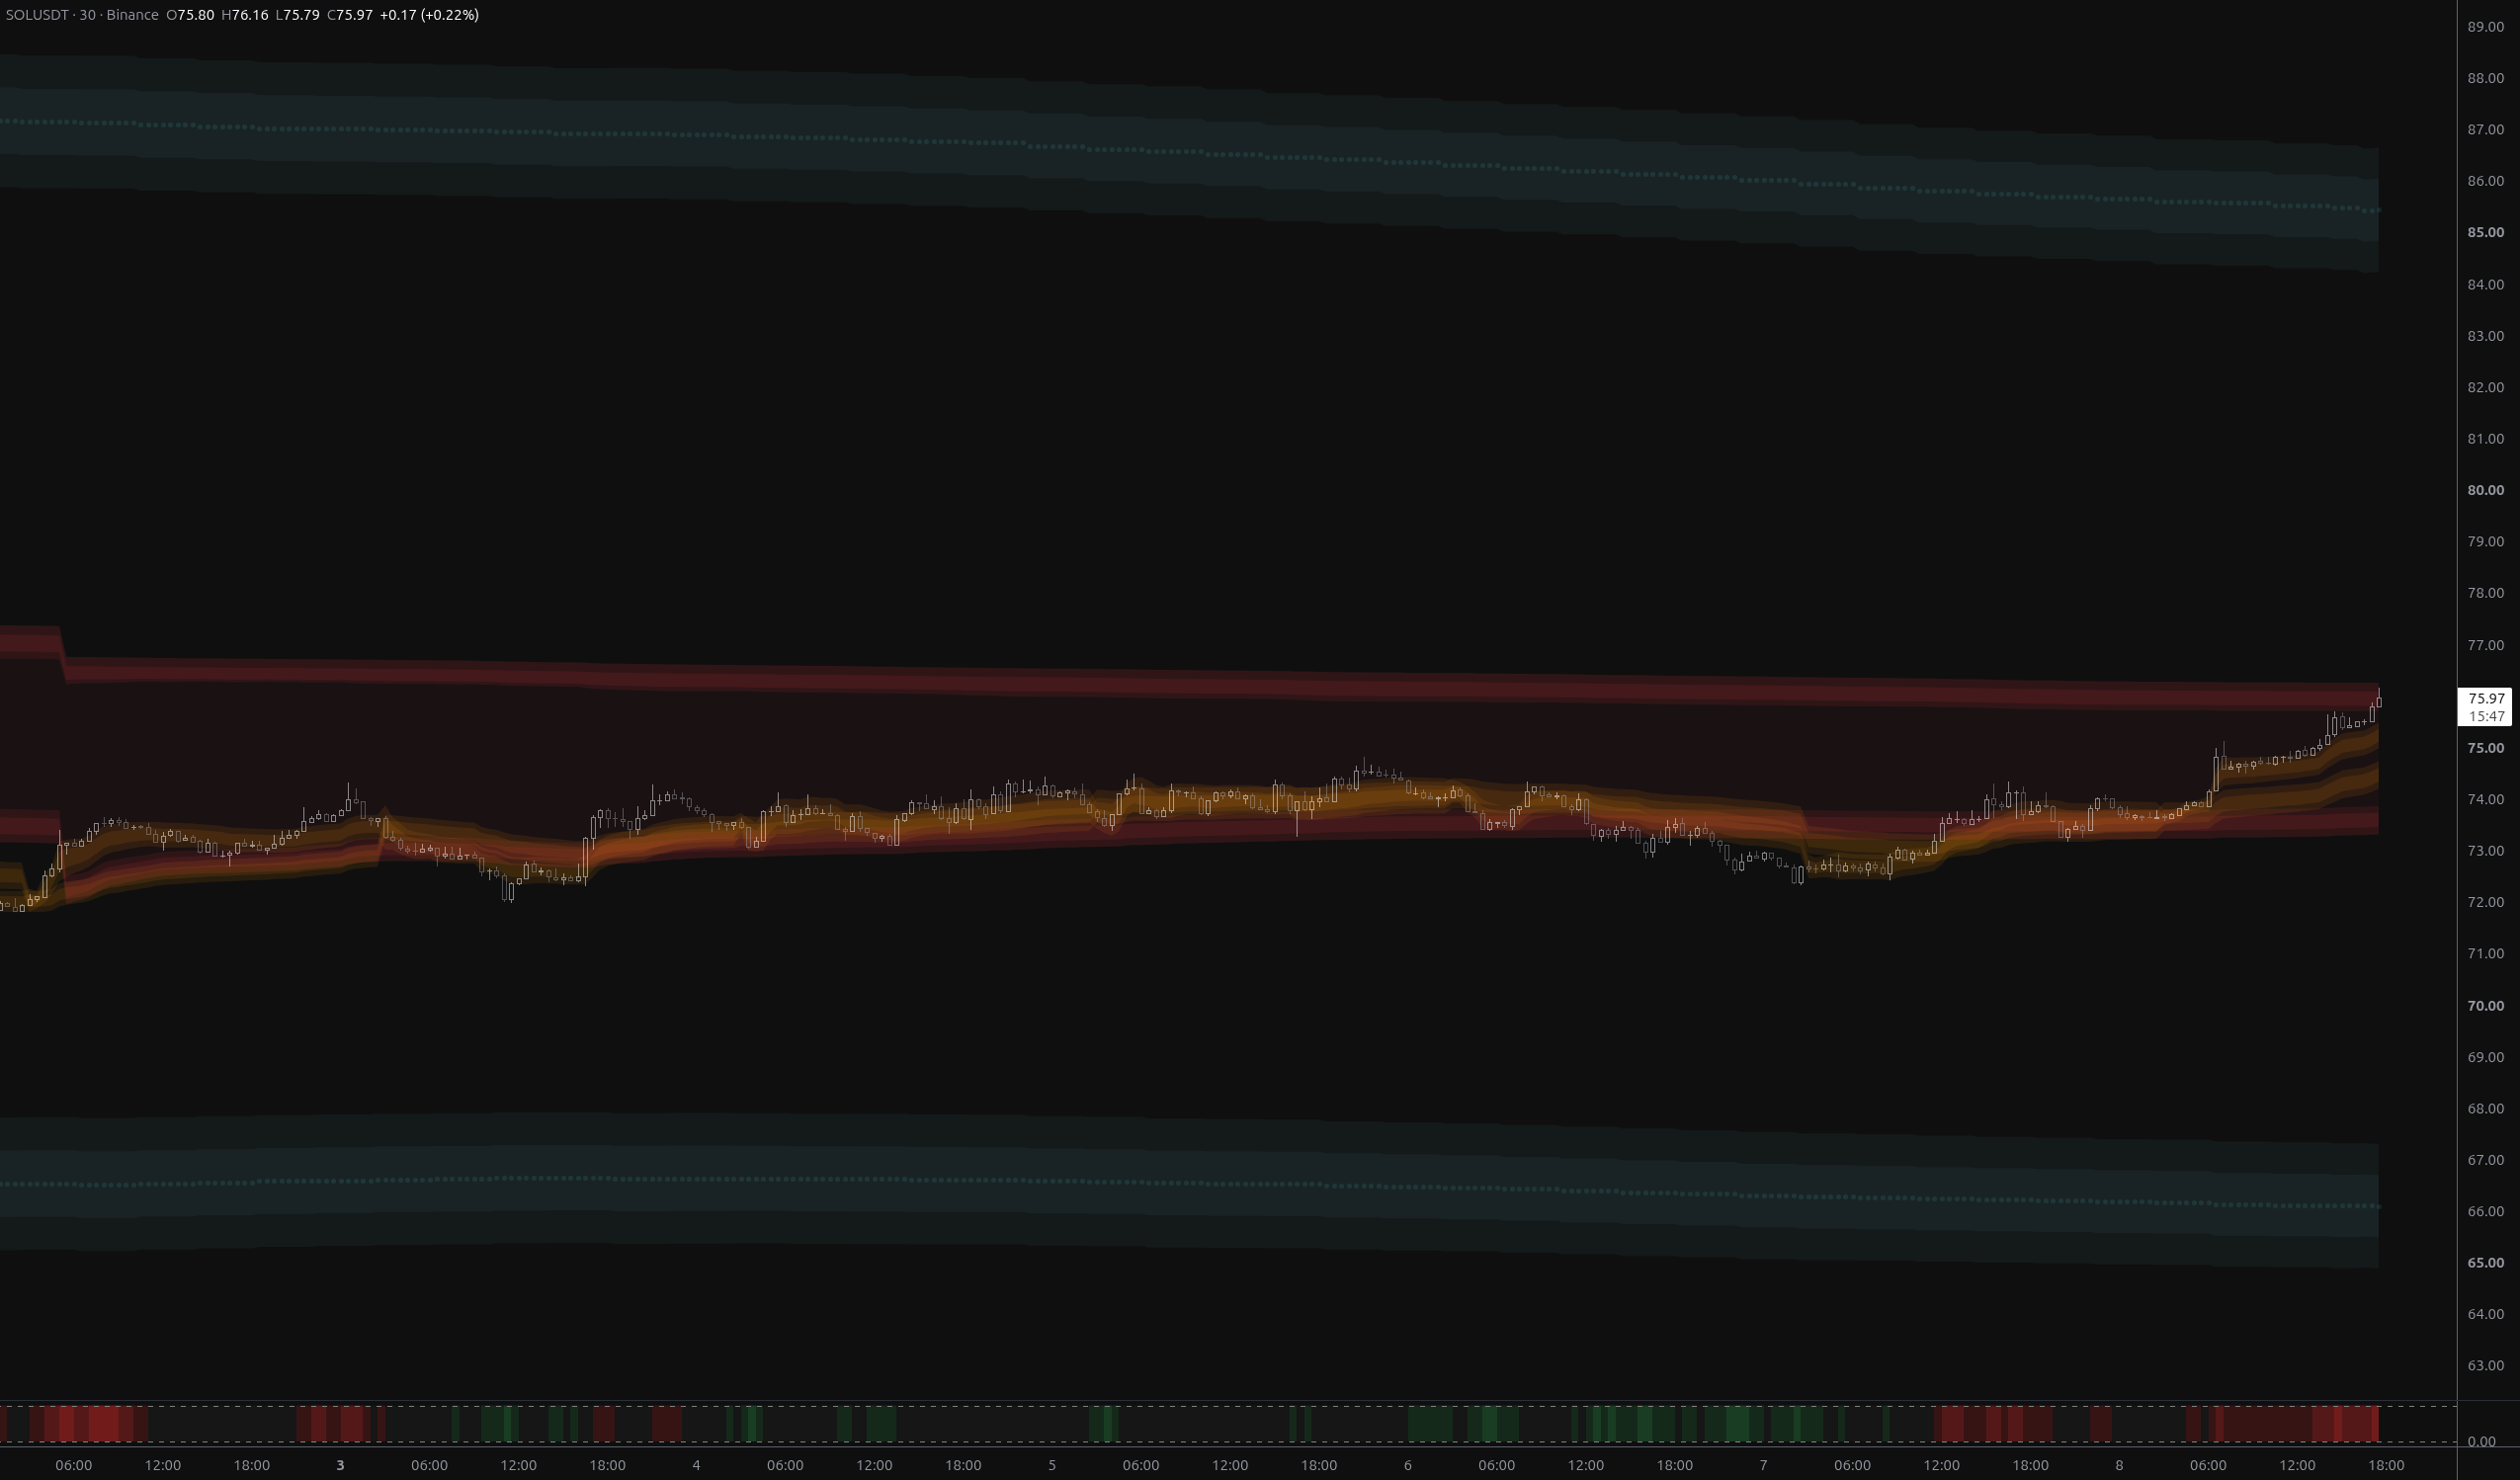
SOLUSDT has fully reversed the breakdown, reclaiming both fair-value envelopes and flipping its nearest structural band to above_1. The $75.73–$76.27 rail zone is now the decisive test.
The content on this page is for educational and informational purposes only and does not constitute financial advice. We are not licensed financial advisors or professional traders. Trading involves substantial risk of loss and is not suitable for every investor. Past performance is not indicative of future results. Always do your own research and consult a qualified financial professional before making any investment decisions.
Executive Summary
SOLUSDT trades at $75.80 after a slow, methodical, and ultimately complete repair of the breakdown that dominated the previous note. Price has printed a higher-high/higher-low sequence off the $72.34 and $73.17 swing lows, has closed above the entire week-anchored fair-value envelope for more than twenty consecutive bars, and has just pushed into the upper band of the pivot-anchored envelope on a large bullish bar carrying roughly 1.8x the recent average volume. The last four bars were a textbook micro-coil (closes at 75.39, 75.43, 75.52, 75.52) that resolved upward to a new high at $75.88.
Two things make this more than a drift. First, the structural grid has done something it had not done in hundreds of bars: the nearest structural band flipped from below_1 to above_1 five bars ago, with the change registered as upward. Price is not in above_1 — it sits roughly 10.9% beneath its lower edge at $84.04 — but it is now marginally closer to the band above than the band below ($67.48 upper edge of below_1, ~11.0% away). After a very long stretch of hovering above below_1, the grid's centre of gravity has shifted upward. Second, the structural classifier has moved from resistance cap to accumulation with high conviction — compressed range with bullish pressure — while the regime classifier has cooled from strong bullish to neutral, also with high conviction.
That combination is constructive but not euphoric: a bullish structural state inside a neutral macro regime is the profile of a grinding advance punctuated by mean reversion, not a vertical trend.
Trend Overview: How the Repair Was Built
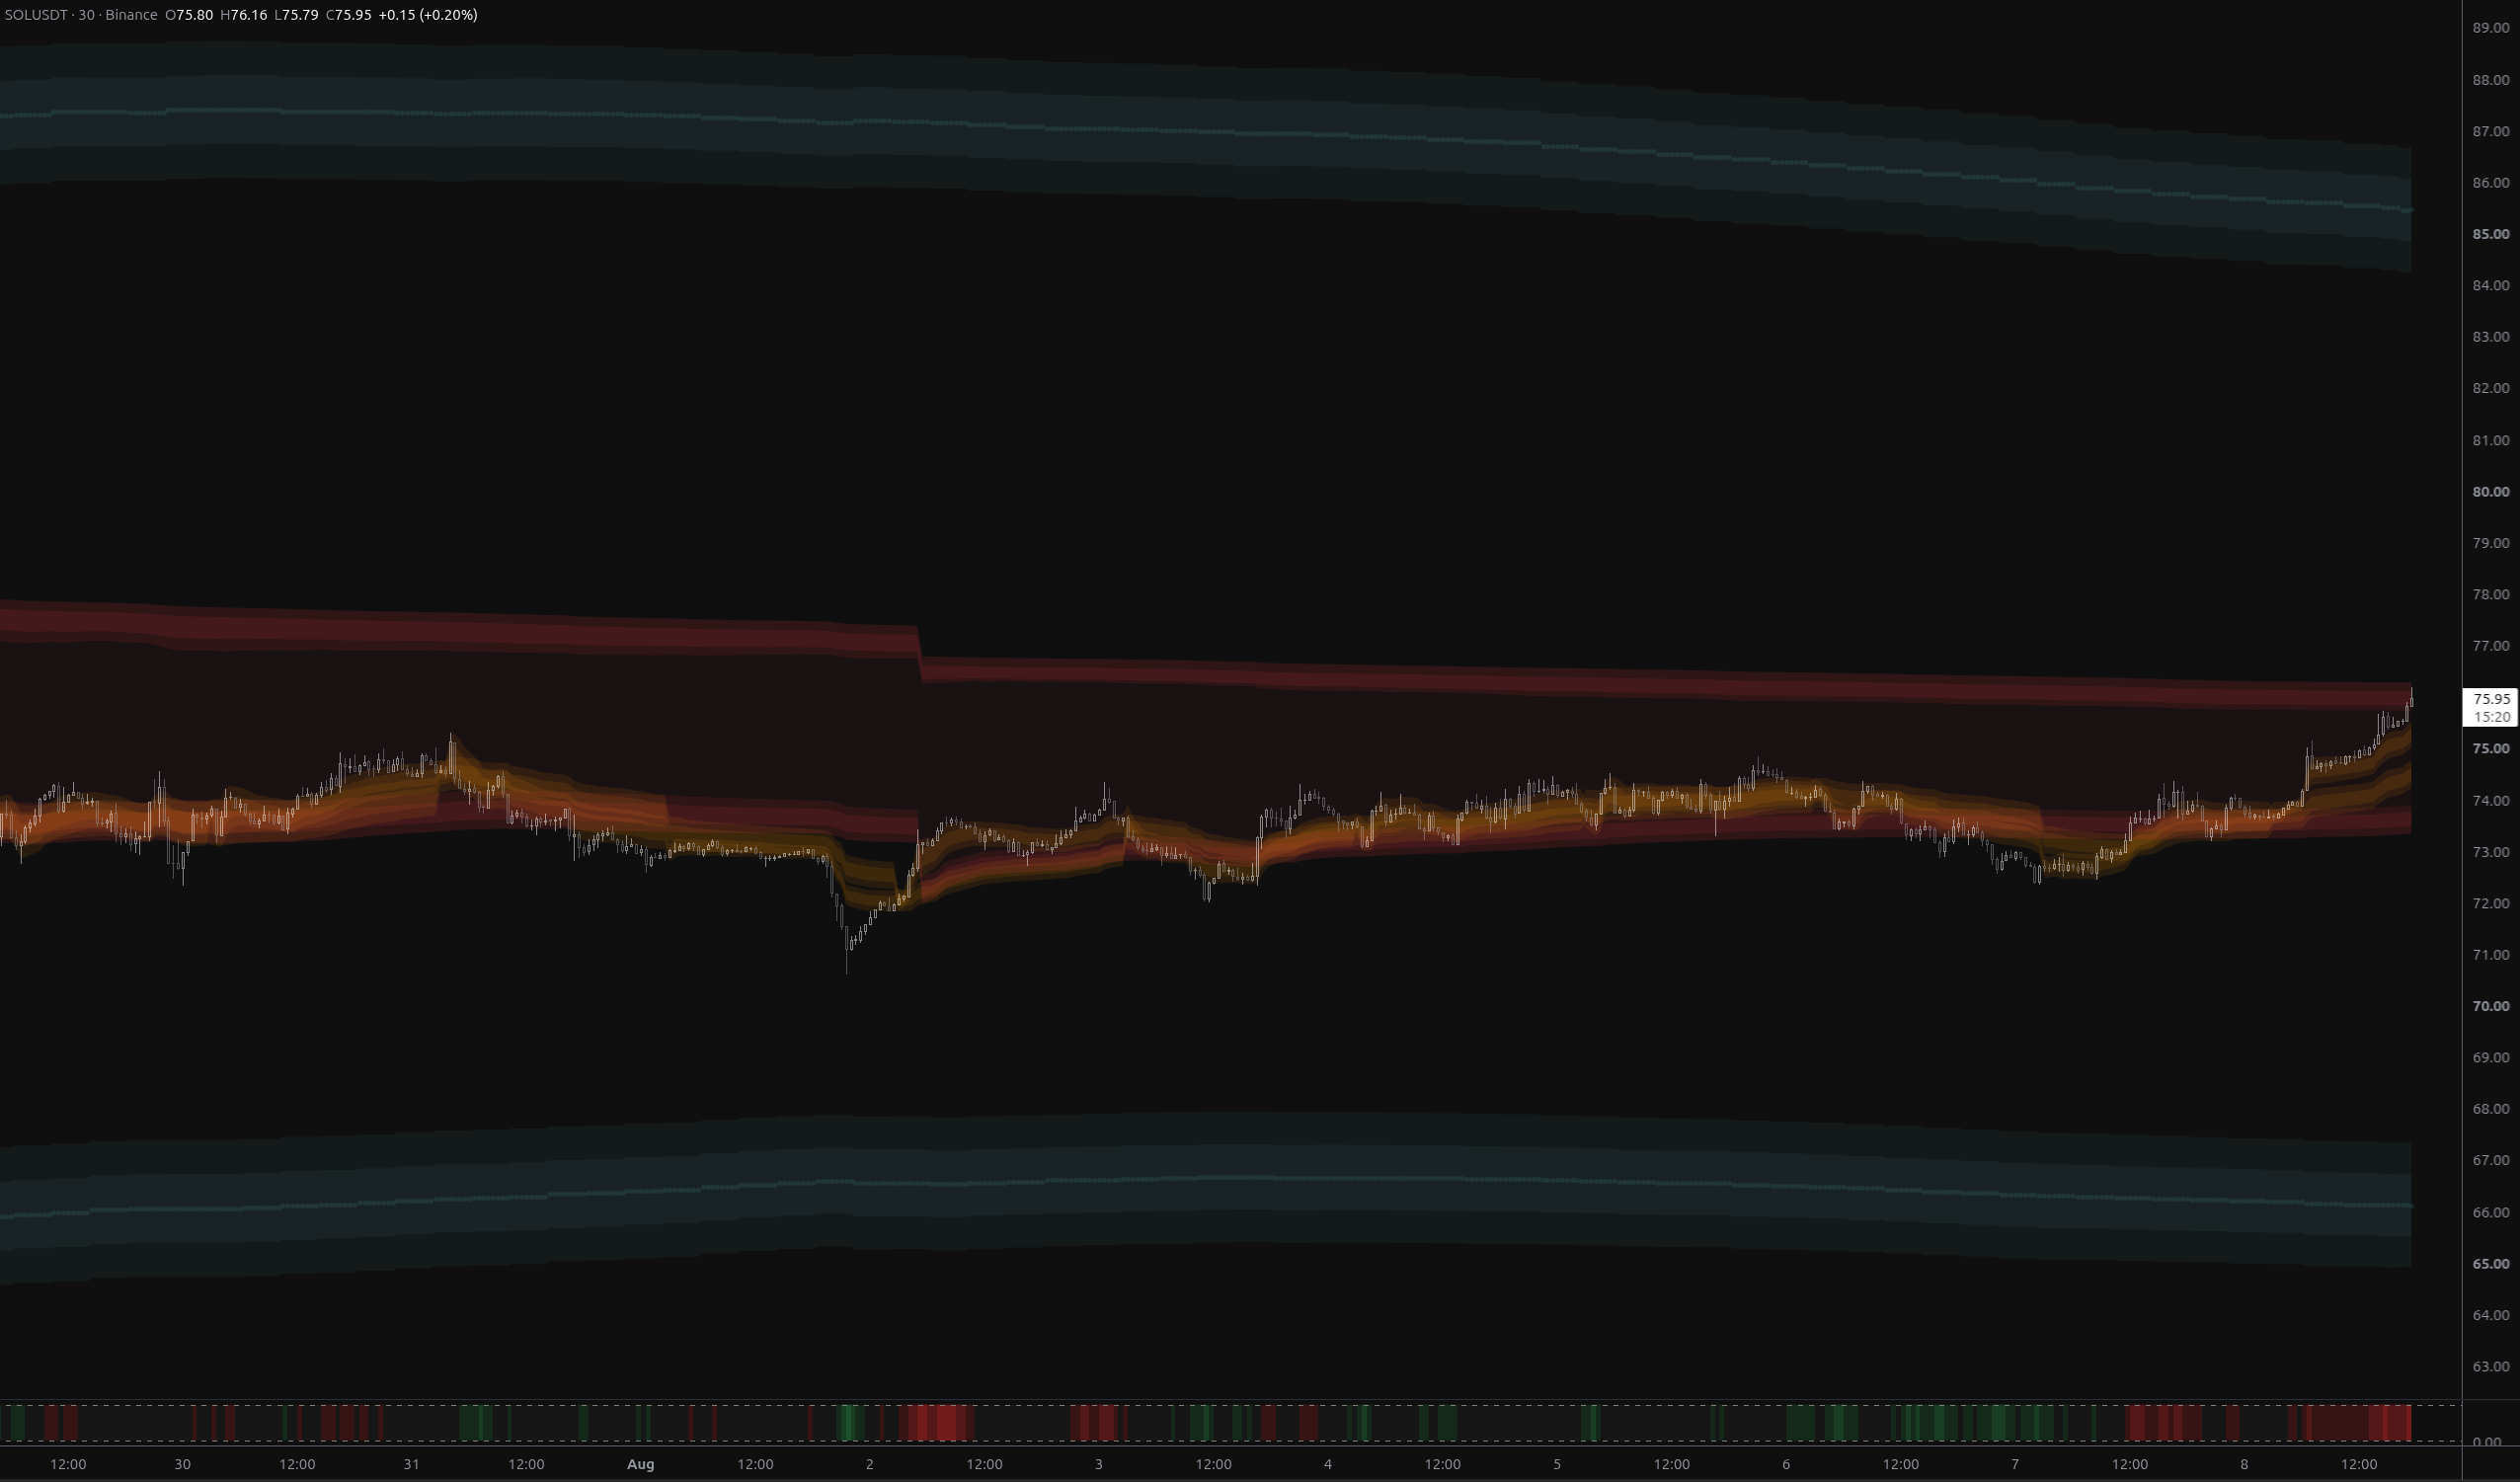
Reading the full series, the sequence is clean and worth walking through, because the shape of the recovery matters as much as its extent:
- Phase 1 — Capitulation and double bottom. The window opens with price working down into the low 72s, printing a low at $71.98 on heavy participation. A recovery to the mid-74s followed, then a second slide that bottomed at $72.34 — a higher low, and the second leg of what is effectively a double bottom.
- Phase 2 — Base building. For dozens of bars price ground between roughly 72.3 and 73.3, spending long stretches beneath both anchored envelopes while the structural read cycled through breakout (downside expansion) and then exhaustion. Crucially, the downside stalled: repeated attempts to extend below 72.5 produced closes back inside the range instead of continuation.
- Phase 3 — Reclaim. Price recovered the lower anchored band, then the fair-value lines, then the week envelope's ceiling. This was where the bearish case died — not on a single spike, but on a persistent hold above the shelf that had capped the earlier bounce attempts.
- Phase 4 — Expansion (now). Twenty-one bars ago a very large bullish bar (roughly 4.6x average volume) took price through the mid-74s. Since then: 74.83 → 75.14 → 75.25 → 75.60 → 75.88 in highs, with each pullback shallower than the last and every volume spike on the advance closing bullish. The last swing high stepped from $74.35 to $75.14; the last swing low stepped from $72.34 to $73.17.
The chart's geometry supports this: a long, flat, coiled base of well over a hundred bars with a rounded bottom, followed by a right-hand lift that leaves price above every plotted fair-value line for the first time in the visible window.
How the Previous Analysis Held Up
Plainly: the previous note's base case was wrong, and its least-likely branch is what happened. It deserves to be marked honestly.
| Prior scenario | Verdict | What decided it |
|---|---|---|
| 1. Bear continuation toward below_1 (called most likely) | Invalidated | The stated invalidation was a sustained close back above $73.86. That happened, and price has since held far above it. The below_1 objectives quoted then (~$67.97 / $66.70) were never approached — the lowest print since is $71.98. |
| 2. Range rebuild between the break low and the envelope rails | Partially played out, then superseded | Price did base for a long stretch, but the base resolved upward through the rails rather than converting into a lower shelf. |
| 3. Fast flush directly into below_1 | Invalidated | Never triggered. There was no further volume expansion with closes pinned at lows; instead the heavy-volume bars flipped to the bullish side. |
| 4. Failed breakdown and full reclaim (called least likely) | This is what occurred | The exact checklist it specified — recover the near rails, close above the invalidation shelf, then reclaim the upper rail and the prior swing high — was completed in sequence. |
What the prior read missed. It treated a long compression that broke lower on heavy volume as distribution resolving into trend. In hindsight, the heavy volume at the lows was absorption, not distribution: the break failed to extend, the second low came in higher, and the oversold pressure readings it explicitly dismissed as "continuation artefacts" were in fact marking the end of the move. The lesson is structural rather than tactical — a breakdown into a total structural vacuum, with the nearest band more than 18% away, has no magnet close enough to pull price along. Vacuums cut both ways: they let moves travel fast, and they also leave nothing to stop a failed move from being fully retraced.
Where price stands relative to that note. Every resistance level it listed has been taken: the $73.19–$73.86 shelf, the $74.71 rail, the $75.29 prior swing high. The figures themselves have also moved on — the pivot envelope's top band, quoted then at $76.76–$77.40, now sits at $75.73–$76.27, and the week envelope's ceiling, quoted at $74.71, now sits at $74.18. Price is no longer beneath every fair-value envelope; it is above one entirely and inside the top band of the other. That is a complete inversion of the prior condition, and the bearish stance has to be retired rather than adjusted.
Level Structure: The Grid and the Vacuum Above
The structural grid remains the backbone of the longer-term view, and the story it tells is one of enormous unoccupied space around spot.
| Band | Range | Distance from $75.80 | Role |
|---|---|---|---|
| above_2 | $93.50 – $95.87 (mid $94.68) | ~23.4% above | Far-horizon objective only |
| above_1 (nearest band) | $84.04 – $86.40 (mid $85.22) | ~10.9% above | Primary upside structural objective; price sits below its lower edge |
| Open space | $67.48 – $84.04 | price here | No structural level in either direction for roughly 11% |
| below_1 | $65.11 – $67.48 (mid $66.29) | ~11.0% below | Downside magnet only if the whole recovery fails |
Three observations follow:
- The band association has migrated up. For a very long run the nearest band was below_1; five bars ago that flipped to above_1 in the upward direction. This is the first genuine structural progress of the entire cycle. It does not mean price is at resistance — the recorded level tests show closes of 75.39–75.80 against the above_1 lower edge at $84.04 with no rejection registered, because price is nowhere near it yet.
- There is nothing structural to stop this move. The grid offers no level between $75.80 and $84.04. Whatever resistance forms in that stretch has to be built in real time — by the anchored envelopes, by new swing highs, and by round numbers. Markets travelling through vacant grid space tend to move faster than markets rotating inside a band, which is exactly what the previous note said about the downside and is now equally true of the upside.
- The grid's own scale demands patience. Each band is narrow (about 2.8% wide) and the spacing between them is wide. A band-to-band migration from here to above_1 is a double-digit percentage move, which is a multi-session to multi-week project on a 30-minute chart, not a next-few-bars proposition.
Anchored VWAP: Above One Envelope, Inside the Top of the Other
The two anchored views now disagree in a way that is informative rather than confusing, because they describe different horizons.
Week-anchored envelope (the slower, structural view)
Price has been above the entire envelope for 23 consecutive bars — the ceiling sits at $74.18, roughly 2.1% below spot, with the upper band's centre at $73.89 and its lower rail at $73.61. Sustained trade above a week-scale envelope for that long is the single most persuasive piece of bullish evidence in the dataset: it says price is stretched above fair value on the slower clock and has not been pulled back, which is trend behaviour rather than a spike.
Pivot-anchored envelope (the faster, structure-tracking view)
Price has just moved into the top band, which spans $75.73 to $76.27 with its centre at $75.94. Position across the envelope is high but not maxed. The matching support band below sits at $73.32 – $73.86 with fair value at $73.61 — about 2.6% beneath spot. This envelope has not re-anchored in a long time, meaning no fresh counter-pivot has been detected during the advance; its rails carry the weight of many bars and the $76.27 upper rail is therefore the most credible near-term ceiling on the chart.
Being inside the top band means price is stretched relative to every anchor tracked. That is confirmation of trend and the condition under which snap-backs happen. The practical read: the next few bars are more likely to be choppy around $75.7–$76.3 than clean, and the first real test of the advance is whether $76.27 gives way or caps.
Momentum, Volume and Regime Context
Volume. The character of participation has flipped versus the previous note. Then, every spike closed bearish. Now the largest spike of the recent window (roughly 4.6x average) closed bullish, a second (~2.5x) closed bullish, and the current bar is a large bullish candle on ~1.8x average volume making a new high. Two of the four recent spikes closed bearish, so this is not one-way — but the net signature is demand at higher prices.
Pressure/rejection gauge. Reading overbought, rising, with low intensity, and it has held that direction for more than twenty bars. Per its intended use, overbought prints during an established advance are continuation artefacts, not reversal evidence — they earn respect as a short signal only inside a downtrend. The low intensity says the wick structure is not yet showing aggressive rejection at the highs. Treat it as a mild caution against chasing, nothing more.
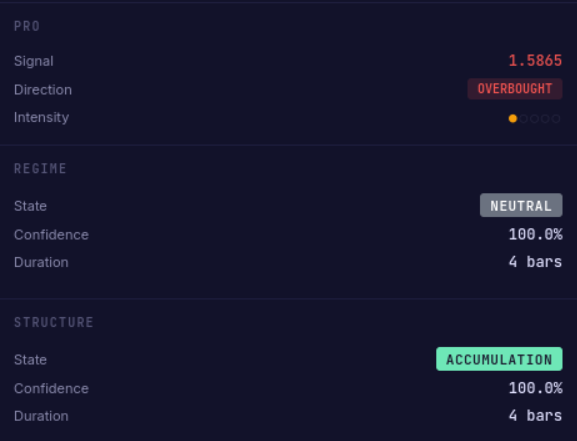
Regime. The macro regime is neutral with high conviction, having cooled from strong bullish. This is the most important nuance in the whole read. Neutral is where mean reversion lives: it argues against expecting a clean, uninterrupted push into the vacuum, and in favour of a stair-step advance with retests. It does not argue for shorts — the bearish regimes are absent.
Structural state. Accumulation, with high conviction, having flipped out of resistance cap. In plain terms: a compressed range with bullish pressure underneath, sitting at the low end of the band it is now associated with. This is one of the states that favours continuation higher, and it agrees with the swing structure (higher highs and higher lows) and with the position above the week envelope.
Scenarios, Most to Least Likely
1. Stair-step continuation into the vacuum (most likely)
The base case is that the uptrend persists but works rather than sprints. Mechanics: friction inside the pivot top band at $75.73–$76.27, some sideways digestion or a shallow dip back toward the last swing high at $75.14, and then a resolution higher. A decisive close above $76.27 opens genuinely empty grid space, at which point the only reference points are new highs and the eventual re-anchoring of the faster envelope higher. The structural objective in this path is the above_1 band — lower edge $84.04, midline $85.22 — a double-digit journey that will require several sessions and probably at least one meaningful retracement. Support that must hold for this path: $74.18 (week envelope ceiling) on any pullback.
2. Mean-reverting pullback to the reclaimed shelf, then continuation (second)
Given a neutral regime and a stretched position inside the top band, a rotation back into fair value is entirely reasonable. The targets on such a pullback are, in order: the week envelope's ceiling at $74.18, its centre at $73.89, and the pivot envelope's lower band at $73.86 – $73.32 around fair value $73.61. As long as the last swing low at $73.17 holds, the higher-high/higher-low sequence survives and this is a buy-the-dip structure rather than a topping structure. This is the path that would frustrate both sides for a while and is nearly as likely as scenario 1 over the coming sessions.
3. Failure at the top band and range reset (third)
If $76.27 caps and price rolls over through $75.14 and then $74.18, the advance converts into a wide range roughly bounded by $73.17 below and $75.88 above. The tells would be rising volume on down-bars, closes back beneath the week envelope, and the structural state reverting from accumulation toward a capped or distributive read. This is a stalemate outcome, not a bearish one — but it would remove the case for chasing and put the grid back in limbo between below_1 and above_1.
4. Full bearish reversal toward below_1 (least likely)
For the bearish case to return it needs the whole staircase dismantled: a sustained loss of the pivot envelope's lower band beneath $73.32, then the swing low at $73.17, then the prior swing low at $72.34. Only with those gone does below_1 — upper edge $67.48, midline $66.29, lower edge $65.11 — become a live discussion again. Nothing in the current volume, regime or structural readings supports this, which is precisely why it is worth defining: it is the cheapest, cleanest invalidation available, and the last cycle proved how quickly a consensus read can be dismantled.
Key Levels Cheat Sheet
| Type | Level | Why it matters |
|---|---|---|
| Resistance | $76.27 | Pivot envelope top rail — the outer stretch limit and the first real ceiling |
| Resistance | $75.94 | Pivot envelope top band centre — mid-band friction |
| Pivot / reference | $75.88 | Current bar high — the level the market must keep taking out |
| Support | $75.73 | Pivot top band lower rail — losing this drops price back out of the top band |
| Support | $75.14 | Last swing high — first pullback shelf |
| Support | $74.18 | Week envelope ceiling — the line that defines "still stretched above fair value" |
| Support | $73.89 / $73.61 | Week envelope band centre and lower rail — fair-value zone |
| Support | $73.86 – $73.32 | Pivot envelope lower band — deeper mean-reversion target |
| Support | $73.17 | Last swing low — breaks the higher-low sequence if lost |
| Support | $72.34 | Prior swing low — structural invalidation of the entire recovery |
| Structural target | $84.04 / $85.22 / $86.40 | above_1 band edges and midline — primary upside objective |
| Structural floor | $67.48 / $66.29 / $65.11 | below_1 band — only relevant if the recovery fully fails |
| Far horizon | $93.50 – $95.87 | above_2 band — beyond the current planning window |
What Would Change the Read
- A decisive close above $76.27 with volume. That clears the outer rail of the faster envelope and leaves price in genuinely open grid space with above_1 as the only structural reference. It is the trigger that turns "grinding advance" into "band-to-band migration."
- A close back beneath $74.18. Losing the week envelope's ceiling after 23 bars above it would neutralise the strongest bullish evidence on the board and shift the odds toward scenario 3.
- A loss of $73.17. That breaks the higher-low sequence and reopens the downside discussion; $72.34 beneath it is the point at which the grid's lower band becomes a legitimate target again.
- Rejection wicks with rising intensity at the highs. The pressure gauge is currently overbought with low intensity, which is benign in an uptrend. Intensity building at the highs alongside bearish closes would be the first honest warning that supply has returned.
Conclusion
The market has spent this cycle proving that a structural vacuum is a double-edged condition. The breakdown that looked decisive failed for want of a magnet, and the recovery has now carried price above the week-scale fair-value envelope, into the top band of the faster one, and — for the first time in hundreds of bars — nearer the upside structural band than the downside one. The regime's cooling to neutral argues for stair-steps and retests rather than a straight line, and the anchored rails at $75.73–$76.27 are where that argument gets settled first. Above them the road to above_1 at $84.04–$86.40 is structurally empty; below $74.18 the whole advance reverts to a range, and below $73.17 it reverts to a question.
This note is market analysis for educational purposes. It describes structure, probabilities and invalidation conditions, and is not a trade recommendation.
Featured Indicators
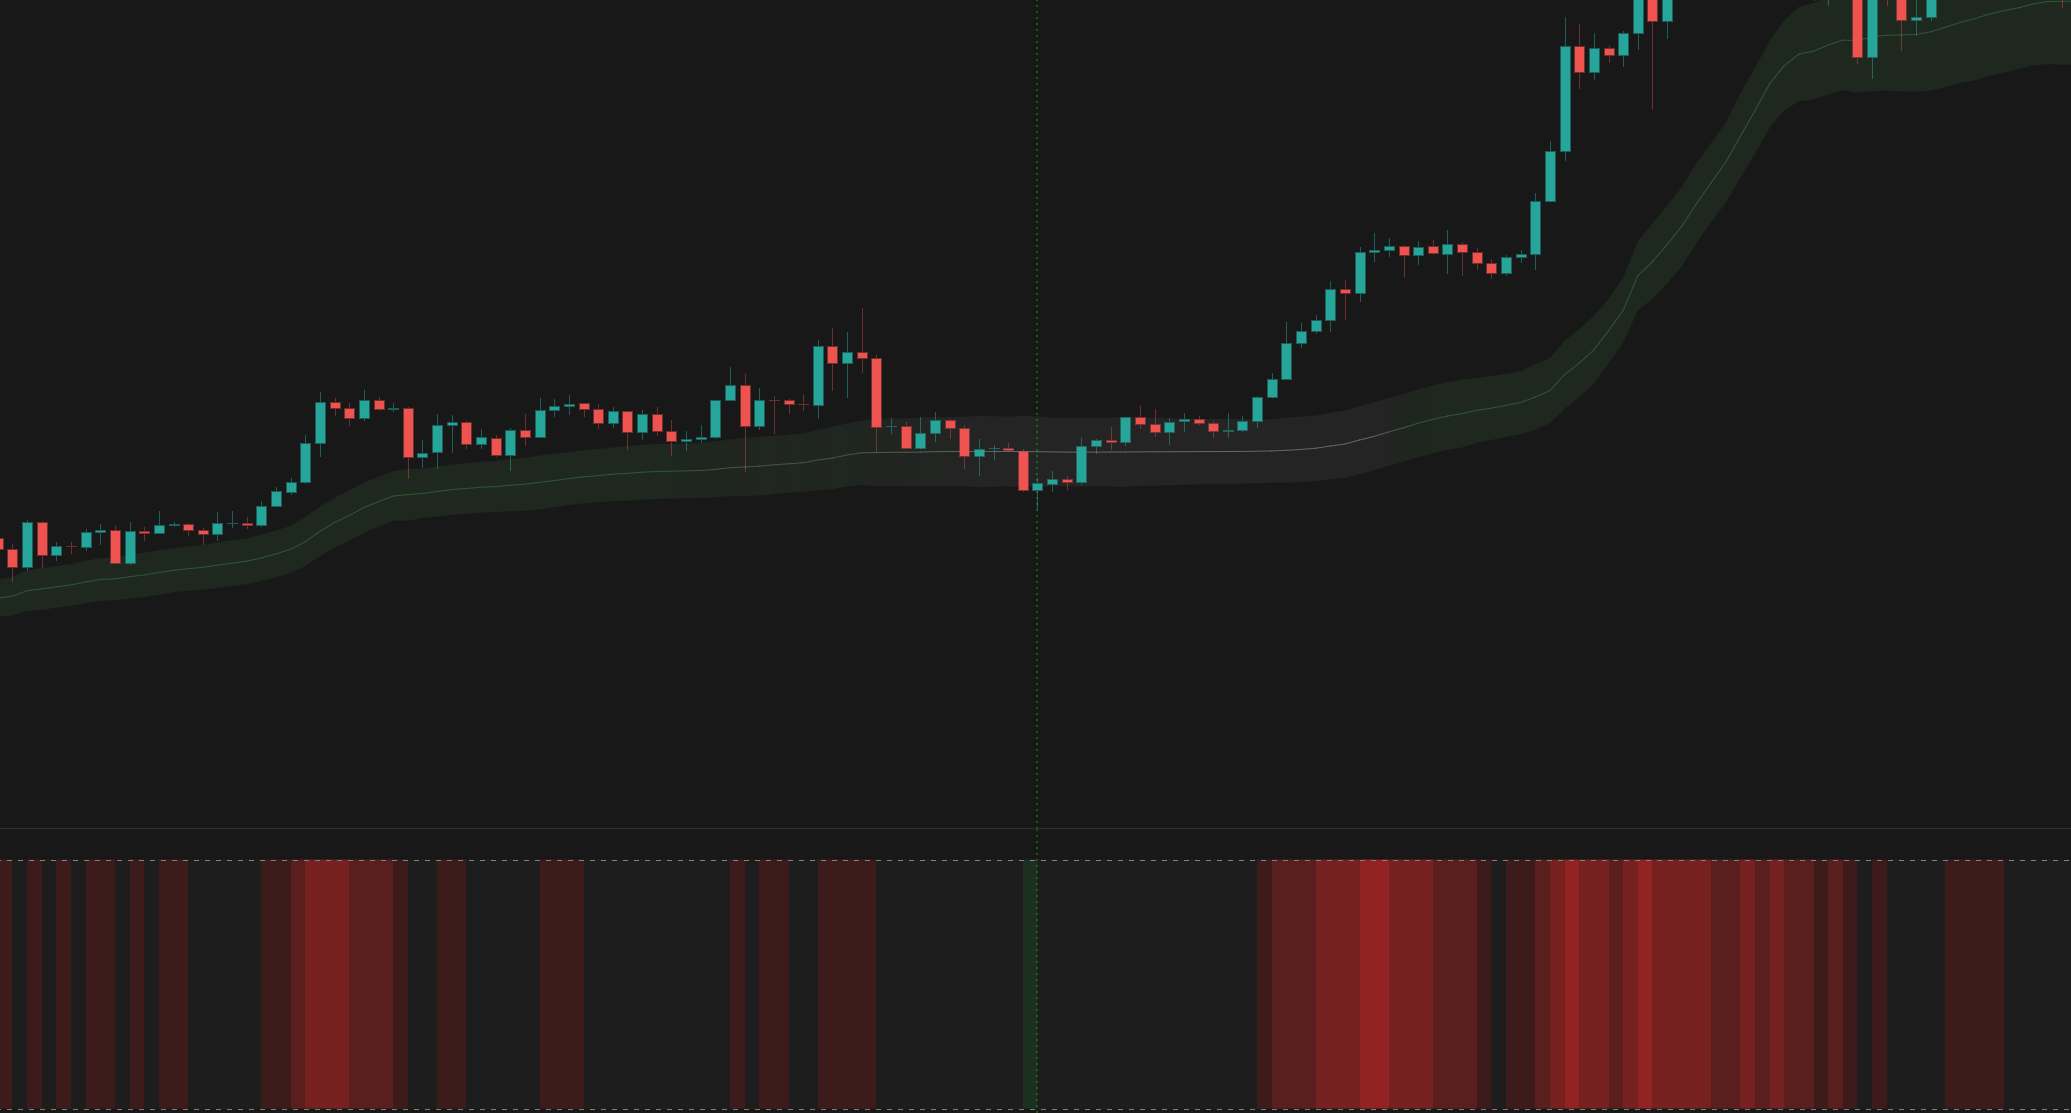
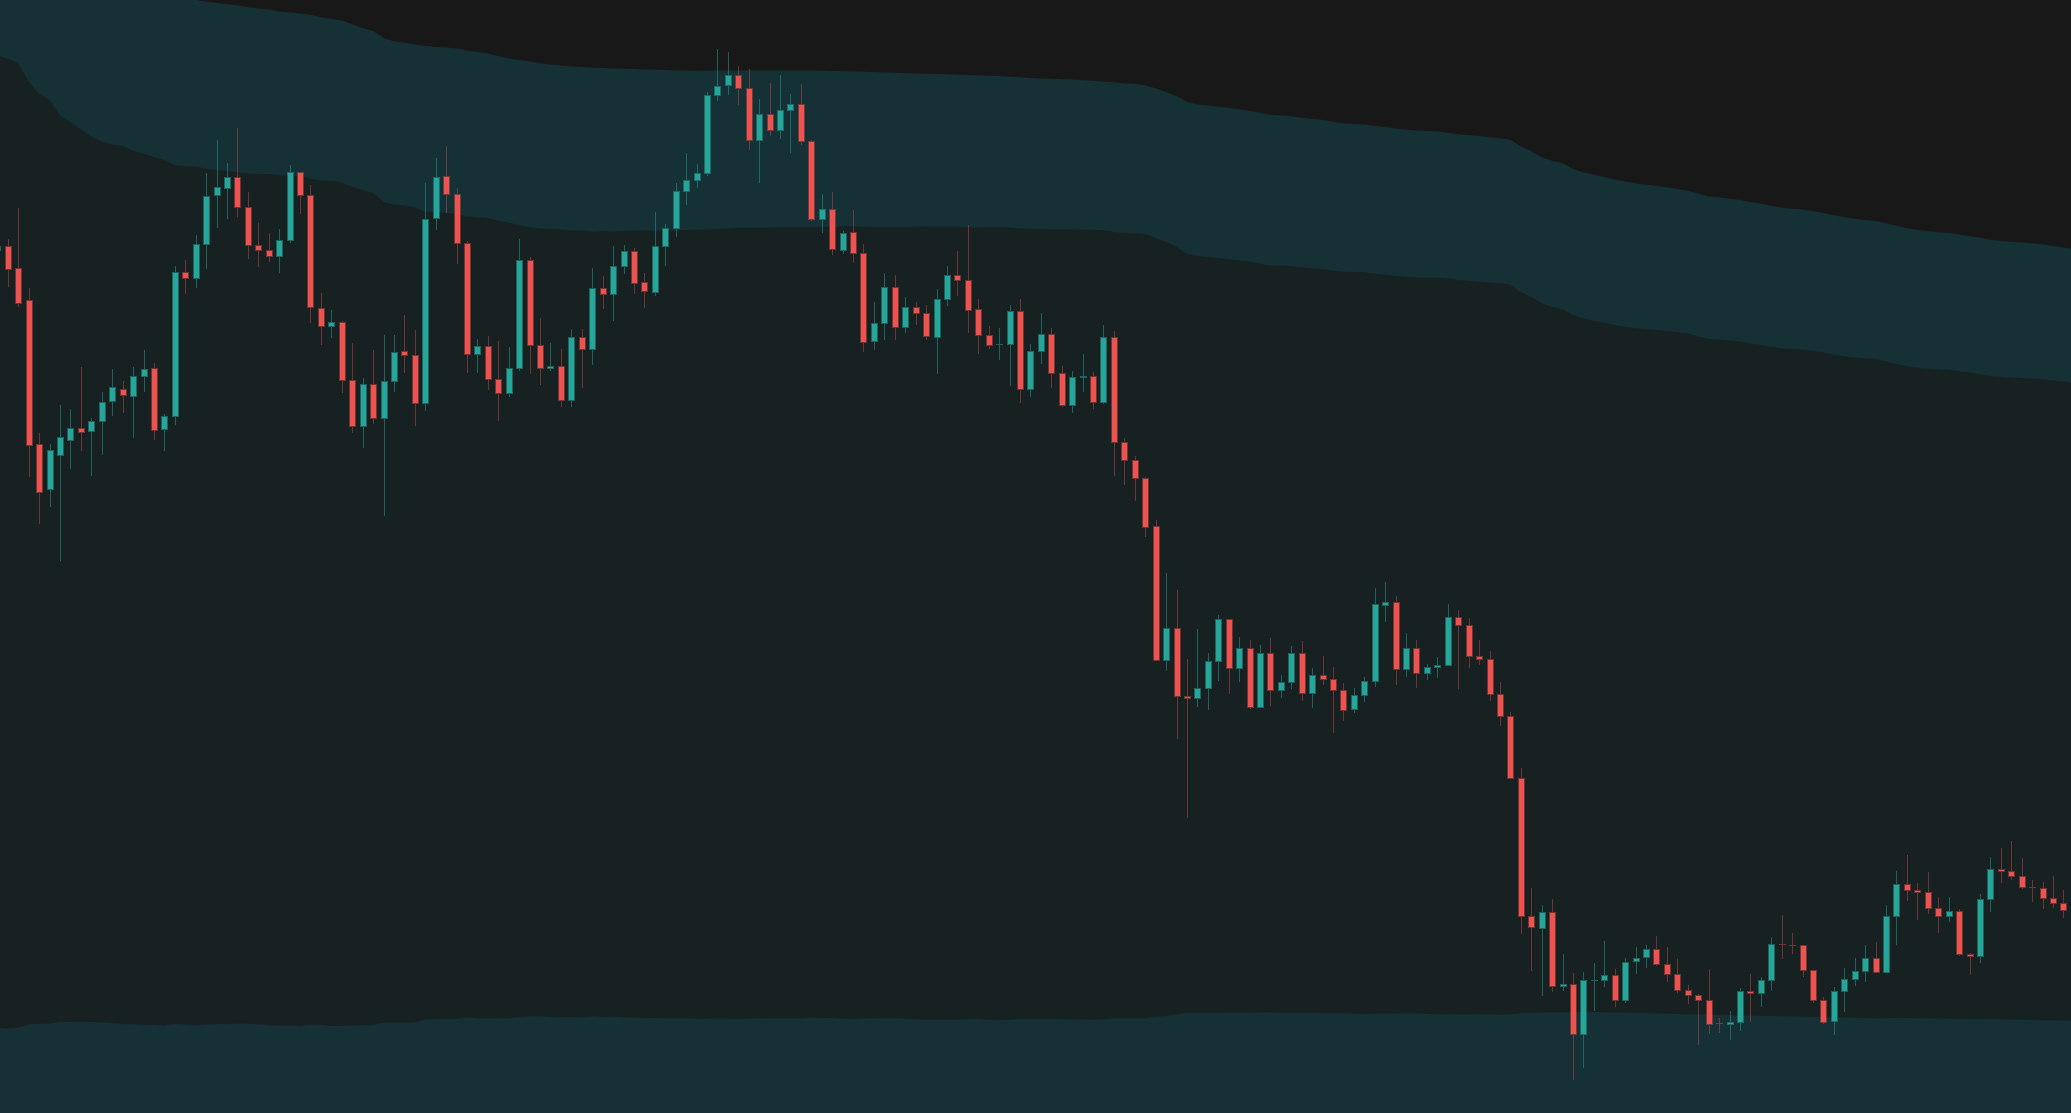
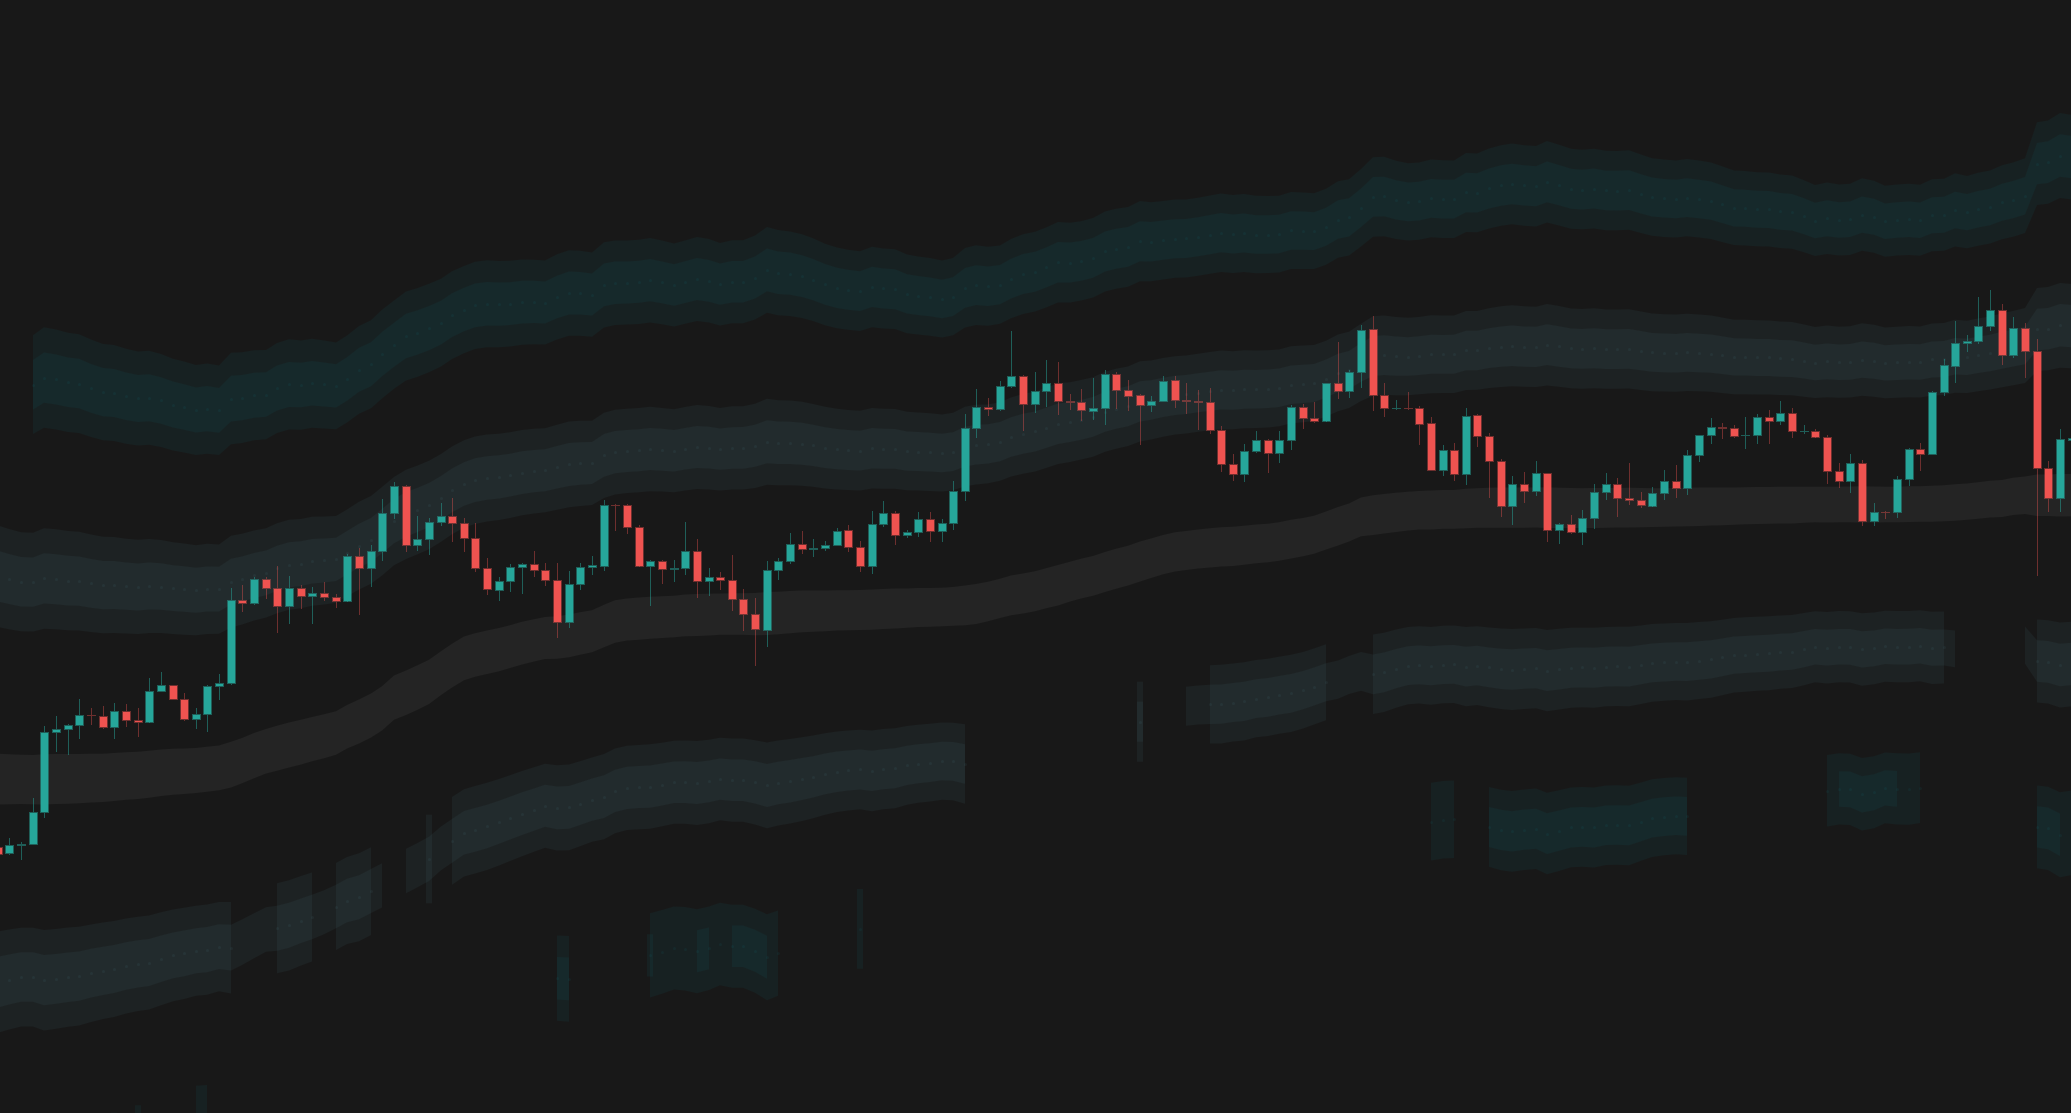
The indicators referenced in this trading idea.
Related Ideas
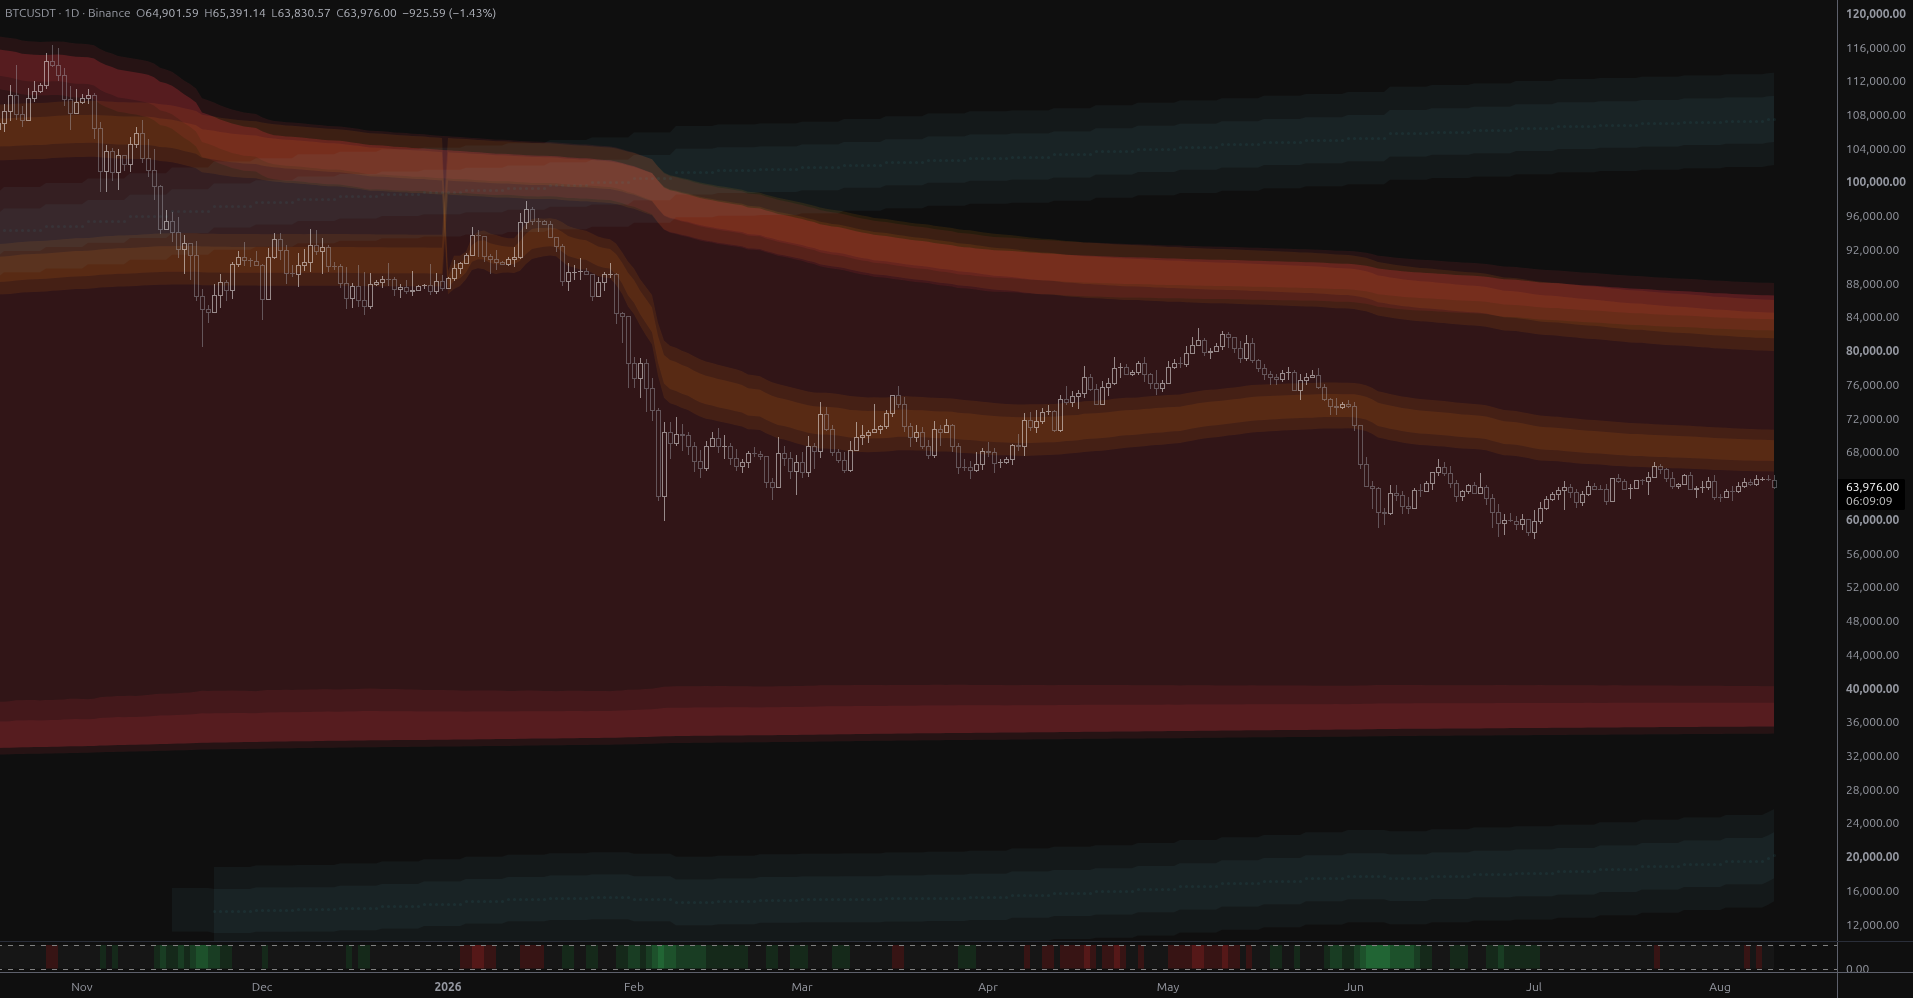
BTC Coils Just Under Its Yearly Value Rail
Bitcoin is coiling at $64,901 just 1.8% below its year-anchored value rail at $66,048, with structural bands far away in both directions. Ranked scenarios, key levels and the air pocket below $57,800.
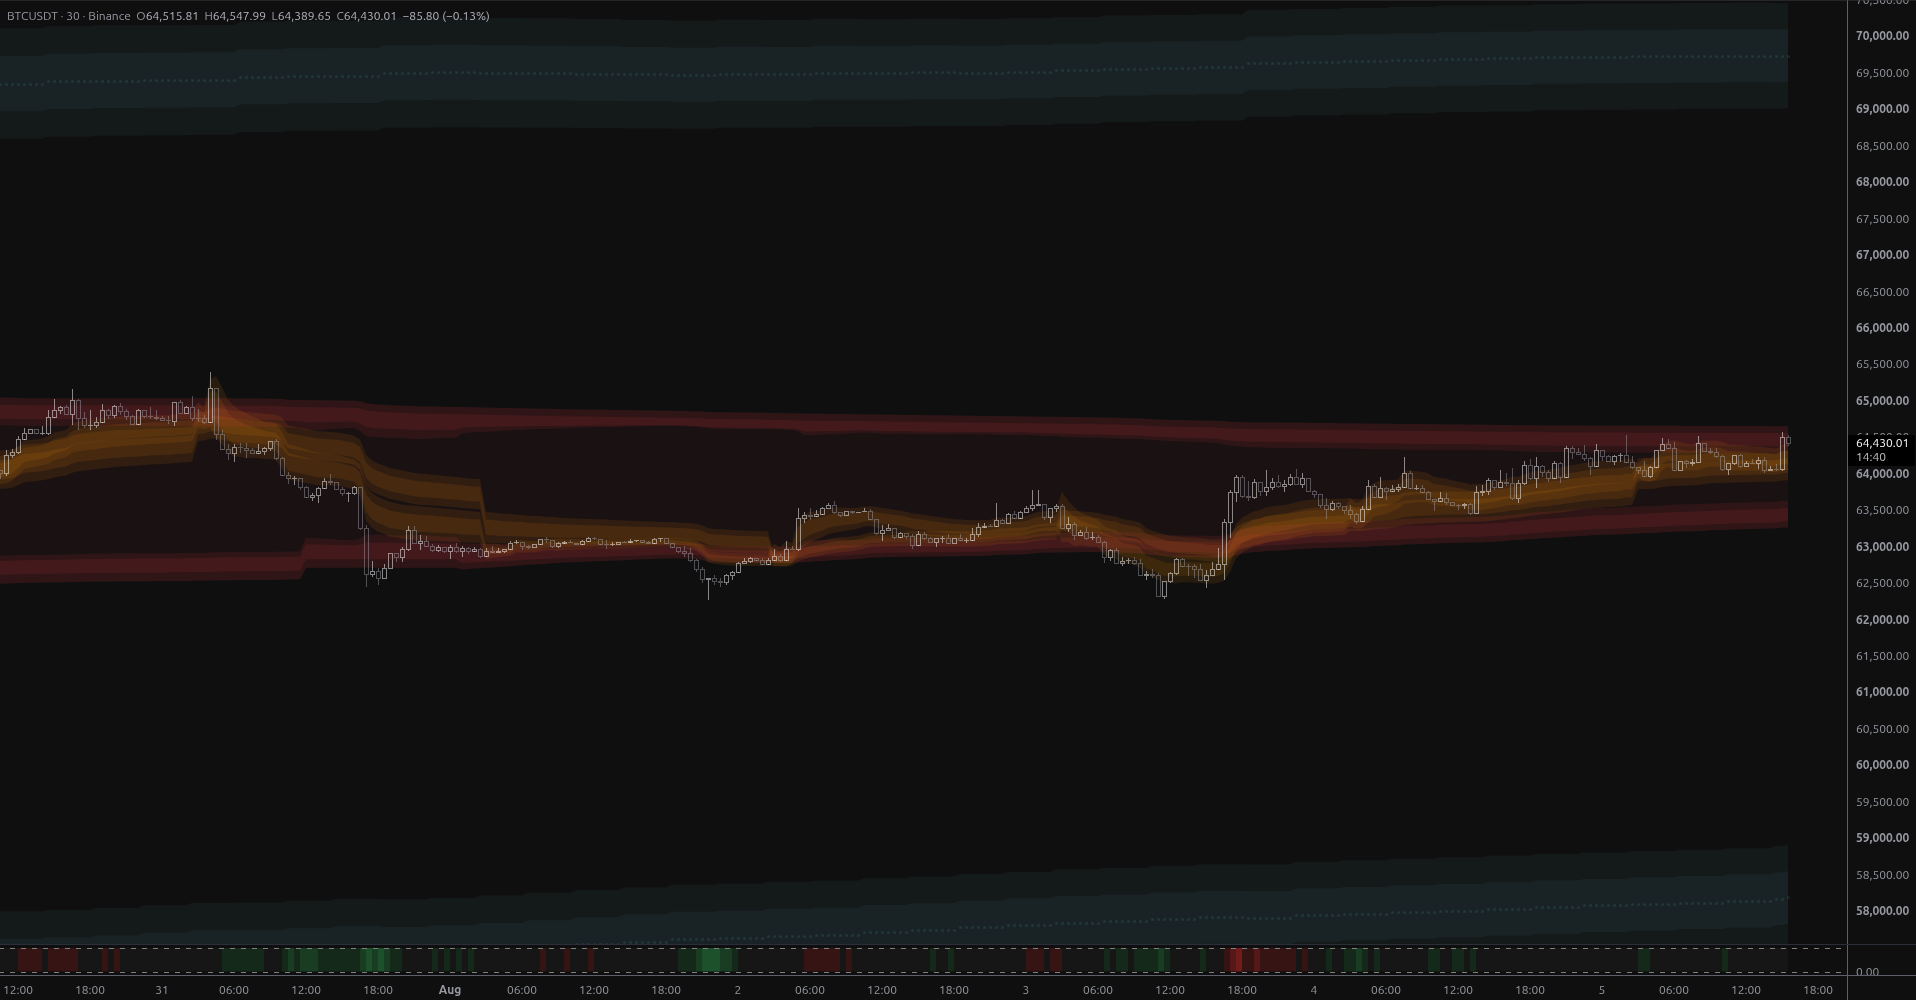
BTCUSDT: Breakout Into Open Structural Air
BTCUSDT broke above week-scale anchored value on 2.7x volume, leaving it stranded in structural open air with the nearest MSL band 6.8% overhead at $68,925 and no support until $59,012.
Bitcoin: Exhaustion at the Envelope Floor
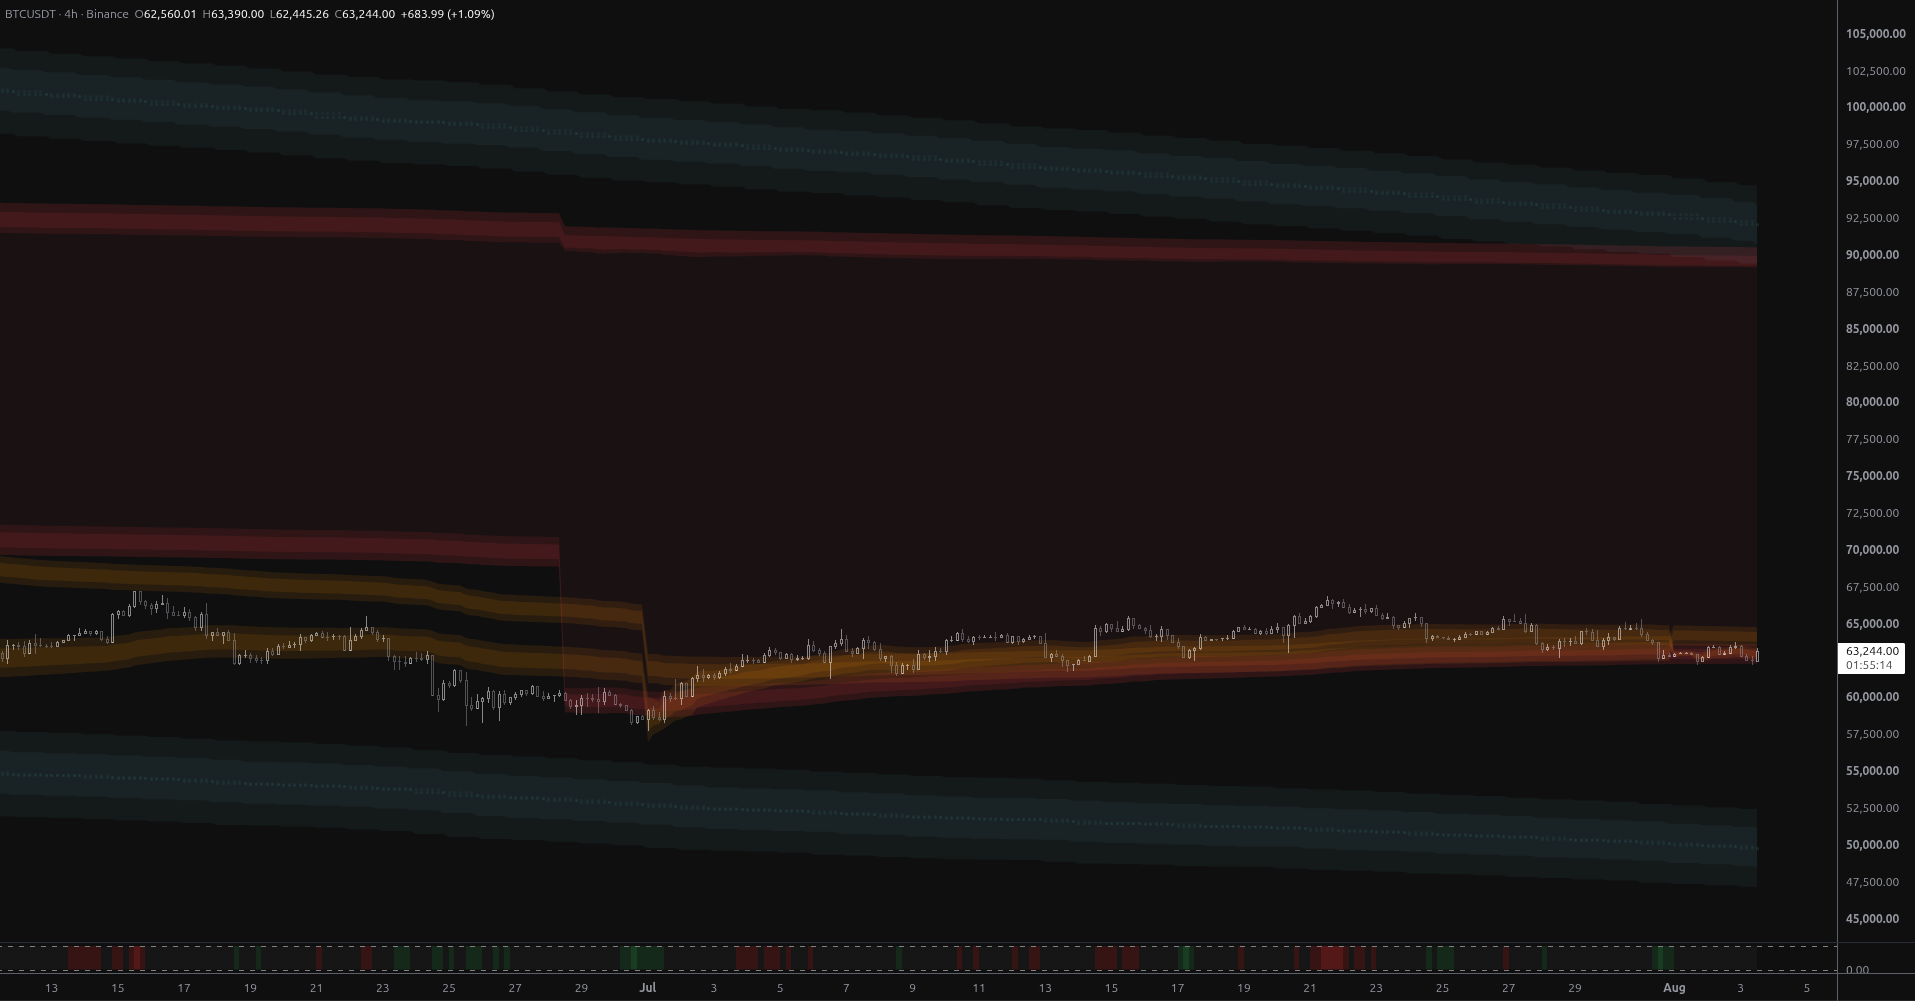
BTCUSDT has rolled over from a rounded top and is grinding below its monthly anchored fair-value envelope. With no MSL structure within 16% either way, $62,335 is the level that decides the next phase.
Connect With Us
Join our community of traders and stay updated with our latest tools and market insights.