
BTC Loses Its MA Bands: Base Retest in Play?
BTC has slipped below both AMAB bands as the regime turns mild bearish and structure flips to distribution
The content on this page is for educational and informational purposes only and does not constitute financial advice. We are not licensed financial advisors or professional traders. Trading involves substantial risk of loss and is not suitable for every investor. Past performance is not indicative of future results. Always do your own research and consult a qualified financial professional before making any investment decisions.
Executive Summary
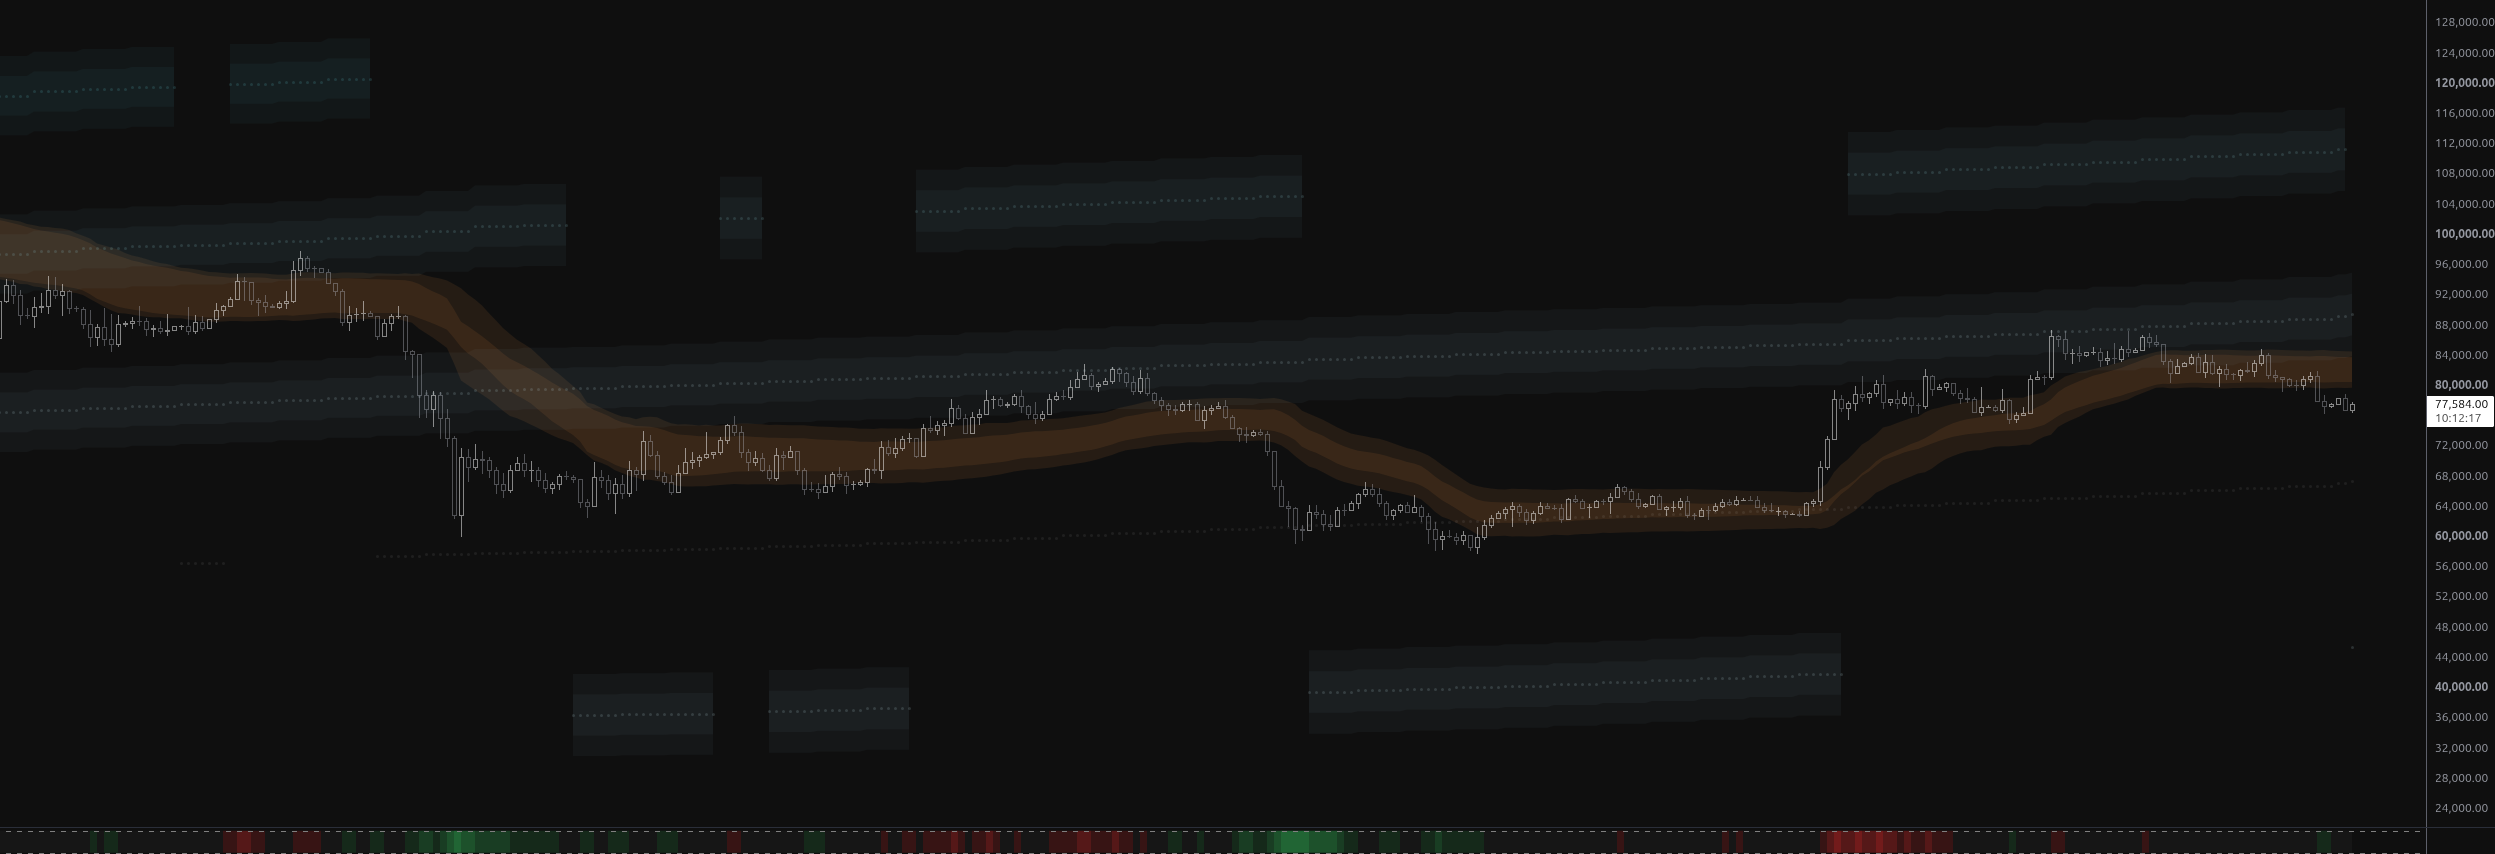
Bitcoin (BTCUSDT, daily) trades at $77,628. It sits in a structural no-man's-land between the top of the MSL base band ($72,927) and the floor of above_1 ($83,924). It is also below both AMAB adaptive moving average bands.
Several signals turned against the bulls in the last two weeks:
- The HMM regime flipped from bullish to mild bearish 13 bars ago.
- The structural classifier moved from accumulation to distribution on the latest bar, with 1.00 confidence.
- The swing structure shows a contracting triangle of lower highs and higher lows.
The combined read is that the September–October advance has stalled. The path of least resistance points toward a retest of the upper base area, though not necessarily a collapse.
Trend Overview: One Year in Context
The 365-day history breaks into five distinct phases.
- Nov 2025 – Jan 2026, distribution from six figures: Price rolled over from ~$107,000. It ground lower through the $90,000s, while AMAB slopes went strongly bearish (MA1 slope near -4.0 in early December).
- Late Jan – Feb 2026, capitulation: A cascade took price from ~$89,000 to a $60,000 wick on 6 Feb. Relative volume hit 4.1x, the largest volume event of the year.
- Feb – May 2026, base-building and relief rally: Price ranged at $63k–$74k, then rallied to ~$82,800 in May. MA slopes turned strongly bullish (+1.4).
- Jun – mid Aug 2026, second leg down and long consolidation: A sharp June breakdown printed the cycle low near $57,800 (1 Jul). Price then compressed for weeks in a tight $62k–$66k box.
- Mid Aug – Oct 2026, breakout and grind higher: An explosive move from $64.5k to $79.5k in four sessions came on 2–3x volume. It was followed by a staircase advance to a $87,396 spike high (20 Sep). October then held a $80k–$86k shelf.
Since the 19 Oct swing high at $84,898, price has printed two large bearish engulfing candles (5 bars and 1 bar ago). It has decisively lost the $80k shelf that anchored October.
AMAB Trend Analysis
| Band | Low | Mid | High | Slope |
|---|---|---|---|---|
| MA1 (high-based) | $80,420 | $82,535 | $84,650 | -0.02 (flat) |
| MA2 (low-based) | $79,666 | $81,781 | $83,896 | -0.06 (flat) |
Price position: Price is below the lower band of both MAs. Only 2 of the last 20 candles closed above MA1, and 15 of the last 20 sat below MA2.
Slope trajectory: Both slopes have decayed from +2.4 in early October through +0.5 and are now essentially zero. Momentum has fully drained from the uptrend.
Pattern read: In AMAB terms, this is the textbook early signature of a rounded top. Price is sticking below MA2 after repeated lower-band touches (0, 2, 3 and 5 bars ago).
Caveat: The slopes are flat, not bearish. This is a loss of trend rather than a confirmed downtrend. A slope reading below -0.5 would upgrade the signal to an active bearish trend.
MSL Band Structure
Current Grid
| Band | Low | Mid | High |
|---|---|---|---|
| above_1 | $83,924 | $89,422 | $94,920 |
| base | $61,931 | $67,429 | $72,927 |
| below_1 | $39,938 | $45,437 | $50,935 |
The MSL grid recalculated two bars ago, so the closest-band label changed from above_1 to base. The real position is unchanged:
- Price sits above base hi, about 6.4% over the $72,927 ceiling.
- It is about 8.1% below the above_1 floor.
- It sits in the inter-band gap, where price tends to travel rather than rest.
A Ratcheting Grid
The cumulated POC has been drifting upward all year:
- February: base spanned ~$52.7k–$63.5k.
- June: base spanned ~$56.0k–$67.1k.
- Now: base spans $61.9k–$72.9k.
The August breakout from the $62k–$66k box lifted volume-weighted value higher. The old congestion zone now sits in the lower half of the current base. A rising POC is a constructive long-term backdrop: value is migrating up even as price corrects.
Band-to-Band Behaviour
Historically, BTC respected these levels well:
- Gap-zone travel: Price often traded in the gap between base hi and above_1 lo for weeks, notably Apr–May and Sep–Oct.
- Failure at above_1 lo: The October rally stalled exactly at the old above_1 lo (~$83.6k). Three failed tests of that level preceded the current breakdown.
- Respect for base hi: On the way up in April, base hi acted as a launch pad. In March, it acted as a ceiling (rejected near $74–76k).
This history makes the $72.9k–$75k zone the natural magnet in a continued pullback. It combines base hi with the 14 Sep swing low at $74,968.
Momentum and Volume
PRO: The Price Rejection Oscillator is neutral (signal -0.52, intensity 0). There is no exhaustion wick pattern yet that would argue for an imminent bounce.
Volume: Volume is subdued at 0.47x average. The breakdown bars carried 1.7x volume, while the latest bounce attempt came on thin participation. That asymmetry favours sellers.
What would change it: An oversold PRO reading near base hi would be constructive. Within a still-rising MSL grid, it would frame a trend-continuation dip.
Regime and Structural Context
RGM regime: Mild bearish, confidence 1.00. This is not crash territory, so longs are not prohibited. It does tilt odds toward weaker follow-through on rallies.
STRC state: Distribution, confidence 1.00, newly shifted from accumulation. Distribution describes a compressed upper range with bearish pressure, which matches the $76k–$81k chop. Structural preference now favours shorts on rallies into resistance over chasing breakouts.
Precedents: The last two times this pairing (mild bearish plus distribution) appeared, outcomes differed:
- Jan–Feb: It resolved into a full band drop.
- Mar: It produced a sideways range before recovery.
Scenarios (Most Likely to Least Likely)
1. Grind Lower into Base Hi (Most Likely)
Path: Price stays capped below the MAs ($79.7k–$80.4k). It breaks the recent $76,300 lows and drifts toward the 14 Sep swing low ($74,968). From there it extends into a retest of base hi at $72,927 as support.
Rationale: This matches the rounded-top AMAB signature, the distribution state and the bearish engulfing sequence.
Outcome: A hold at base hi would keep the higher-low structure alive above the June–July lows.
Invalidation: A daily close back above MA2 mid (~$81,800).
2. Sideways Distribution Range (Moderately Likely)
Path: BTC oscillates between ~$75k and ~$80.5k while AMAB slopes stay flat. This mirrors the March pattern.
Outcome: The range would let the grid's rising POC catch up, setting up a cleaner later decision.
Tell: Repeated PRO oversold readings near $75k with long lower wicks.
3. Bullish Reclaim toward above_1 (Less Likely)
Path: A strong close above MA1 hi (~$84,650) reclaims the October shelf. Price breaks the contracting triangle's upper edge and pushes into above_1 lo ($83,924). From there the target is above_1 mid ($89,422).
Requirements: Expanding volume, positive AMAB slopes above +0.5, and a regime shift back to bullish.
Invalidation: Rejection at $82k–$84k, which would form a fresh lower high.
4. Breakdown through the Base (Least Likely Near Term)
Path: A daily close below base hi ($72,927) on high volume opens base mid ($67,429). Losing base lo ($61,931) would revive the June lows ($57.8k). It would also expose the gap toward below_1 hi ($50,935).
Requirements: A regime escalation to bear or crash and AMAB slopes turning strongly negative.
Key Levels
| Level | Price | Significance |
|---|---|---|
| above_1 mid | $89,422 | Upside objective in a full recovery |
| Swing high (prior) | $87,396 | September spike high, top of triangle |
| Swing high (last) / MA1 hi | $84,898 / $84,650 | Lower-high resistance cluster |
| above_1 lo | $83,924 | Band floor; October rejection zone |
| MA2 mid / MA1 lo | $81,781 / $80,420 | Dynamic resistance; first reclaim test |
| Current | $77,628 | Inter-band gap |
| Recent lows | $76,326 | Breakdown trigger |
| Swing low | $74,968 | Higher-low anchor of triangle |
| base hi | $72,927 | Primary structural support |
| base mid | $67,429 | Value centre of current grid |
| base lo | $61,931 | Line in the sand for the 2026 structure |
| below_1 hi | $50,935 | Tail-risk target |
Longer-Term Outlook
The bigger picture is a market that capitulated in February and double-bottomed near $58–60k by July. Since then it has been rebuilding value higher, as the upward-ratcheting MSL grid shows.
The current pullback reads more like a correction within a recovery than a new bear leg, provided base hi ($72.9k) holds. The near-term signals still lean bearish:
- Price is below both AMAB bands.
- The regime is mild bearish.
- The structural state is distribution.
Patient observers should watch the reaction at $73k–$75k. A rejection-wick hold there would reset the structure for another attempt at above_1. A high-volume close below it would shift the outlook toward a deeper rotation into the heart of the base band.
This article is for educational and analytical purposes only and does not constitute financial advice.
Featured Indicators
The indicators referenced in this trading idea.
Related Ideas
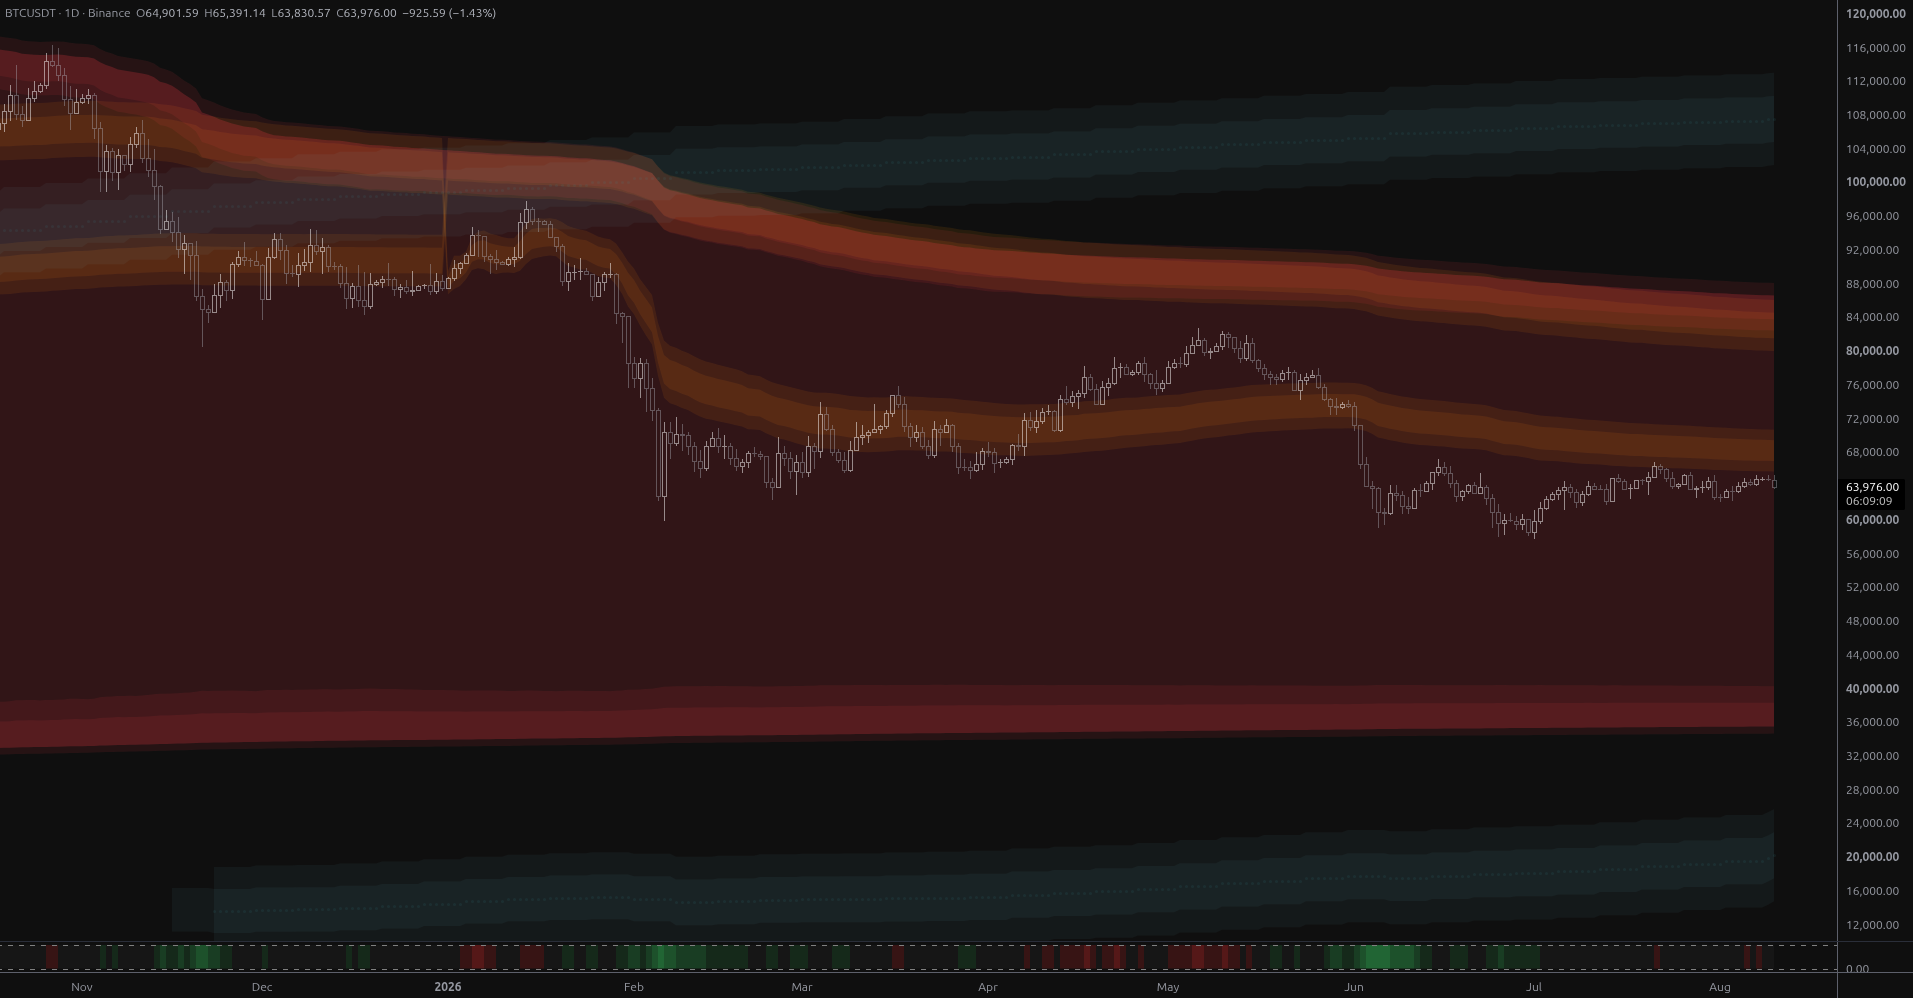
BTC Coils Just Under Its Yearly Value Rail
Bitcoin is coiling at $64,901 just 1.8% below its year-anchored value rail at $66,048, with structural bands far away in both directions. Ranked scenarios, key levels and the air pocket below $57,800.
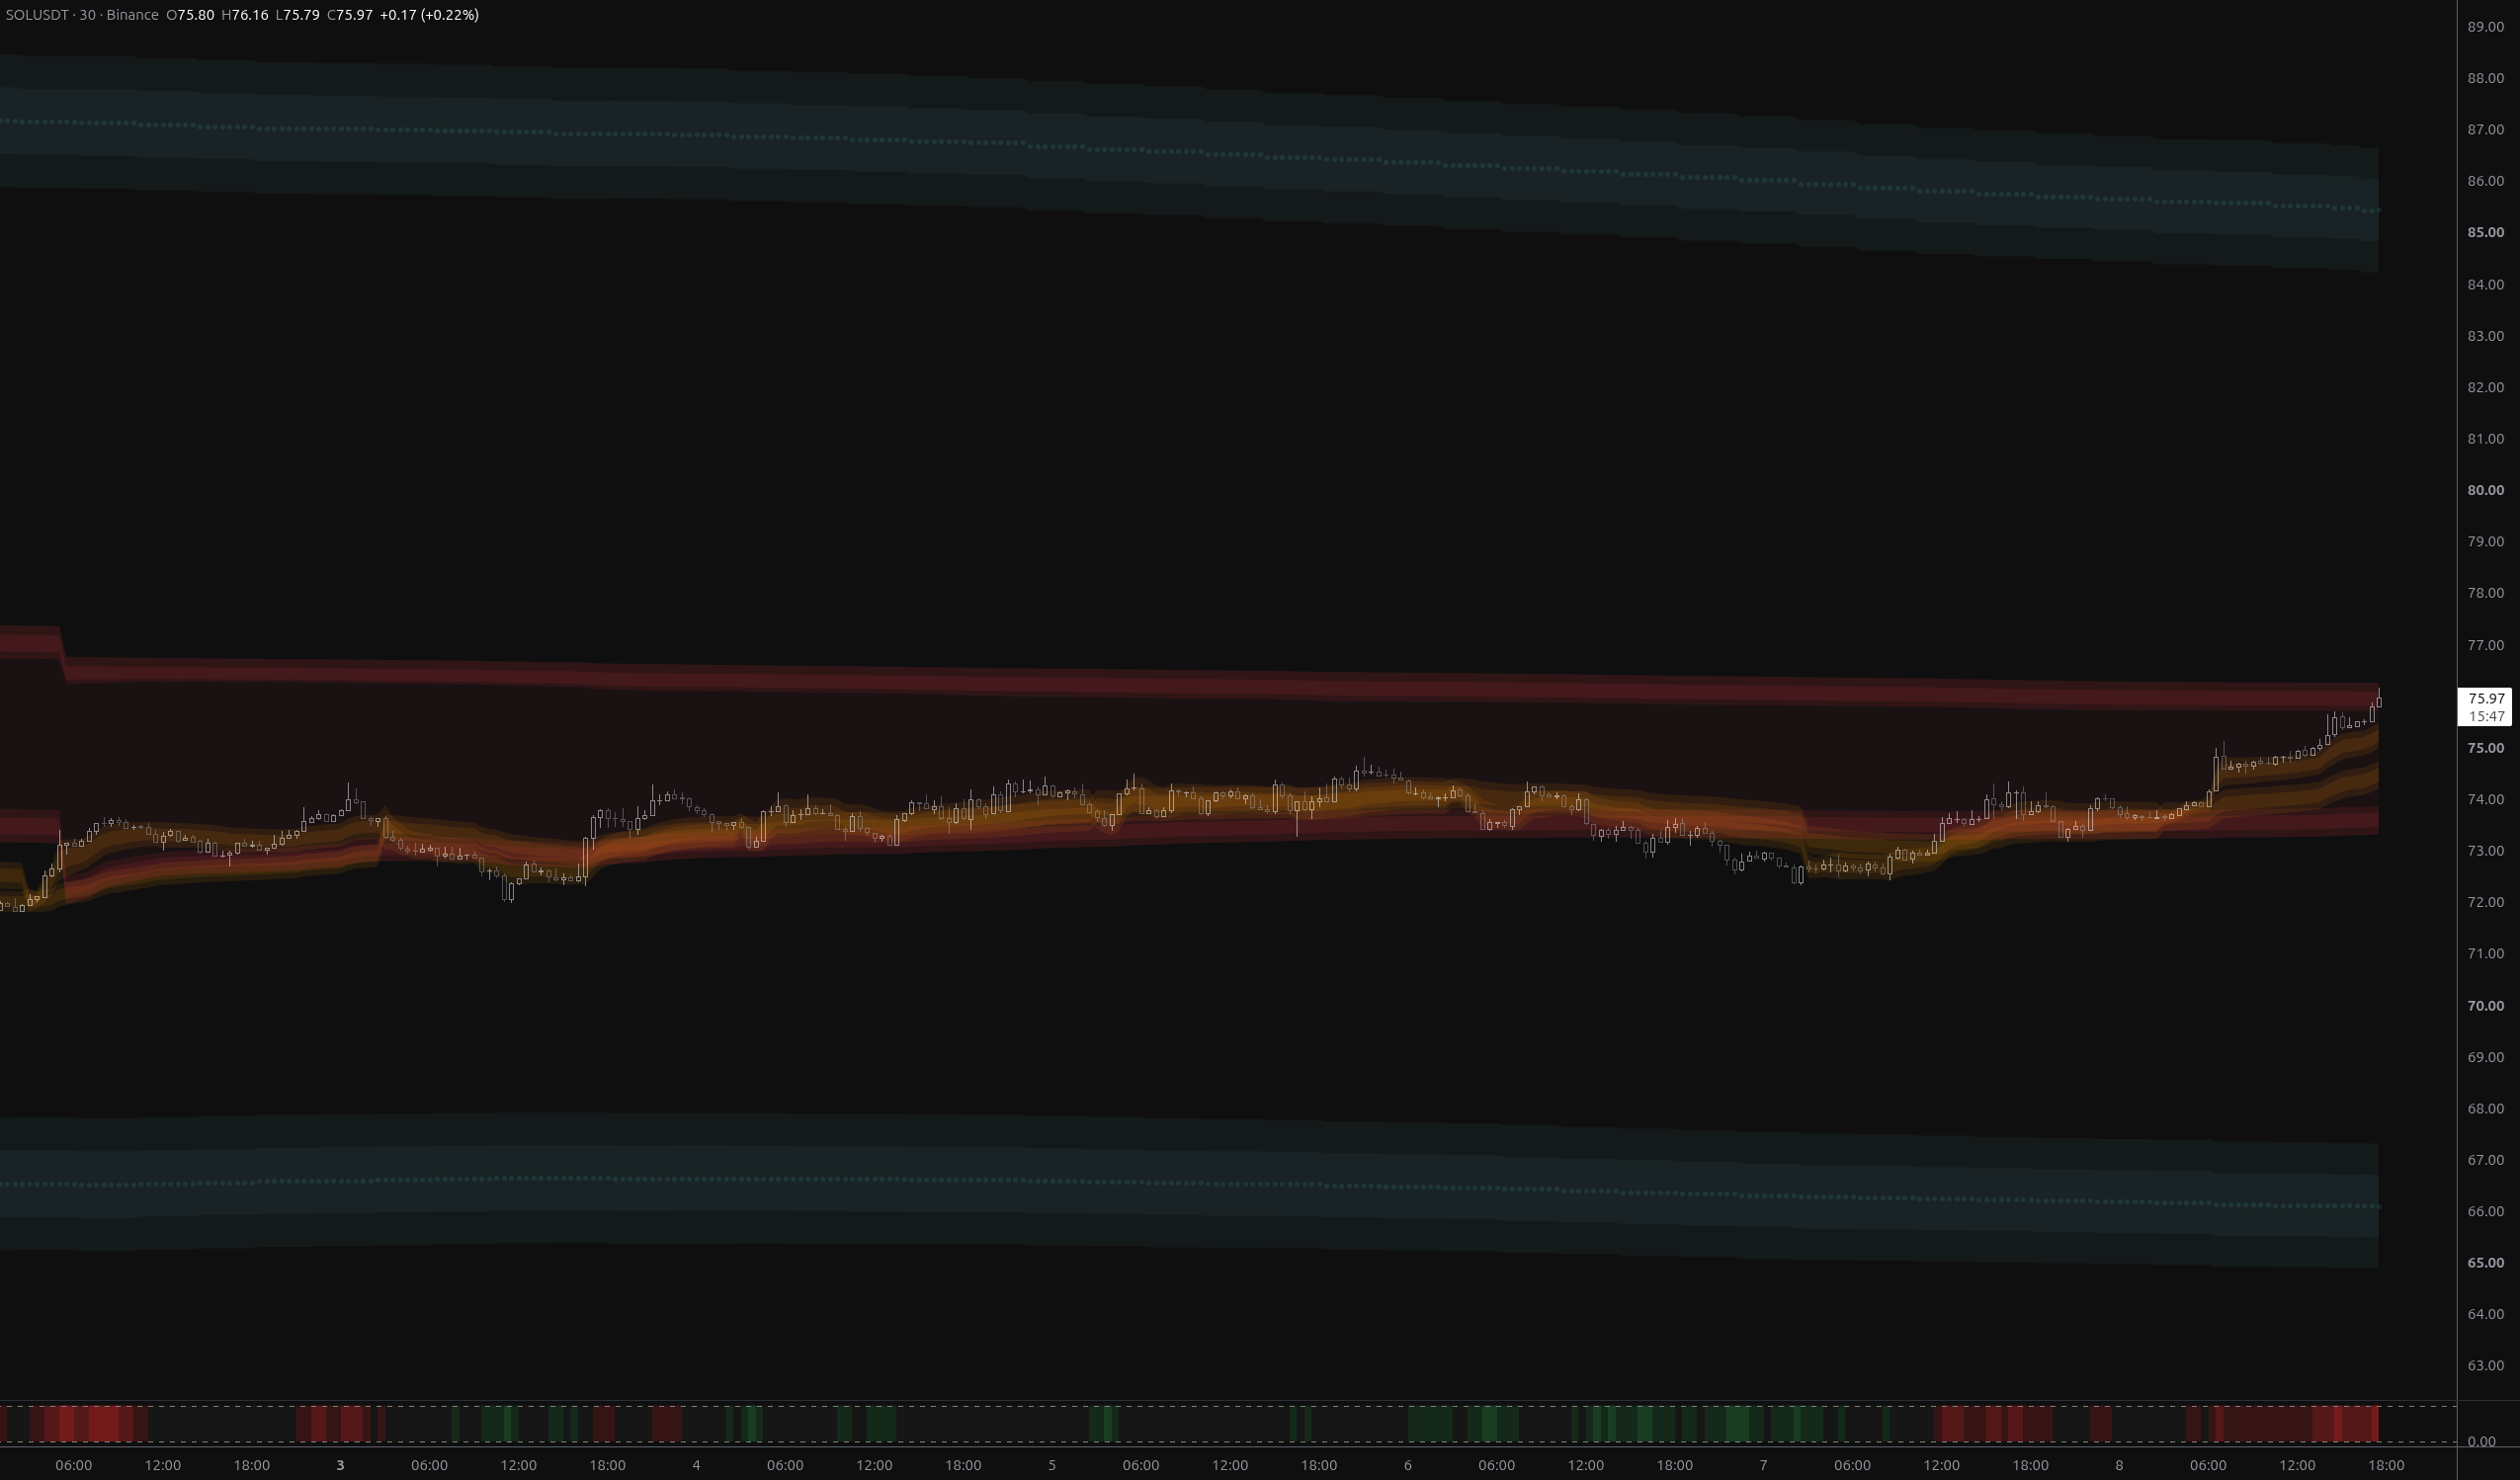
SOLUSDT: Bears Invalidated, $76.27 Now the Test
SOLUSDT has fully reversed the breakdown, reclaiming both fair-value envelopes and flipping its nearest structural band to above_1. The $75.73–$76.27 rail zone is now the decisive test.
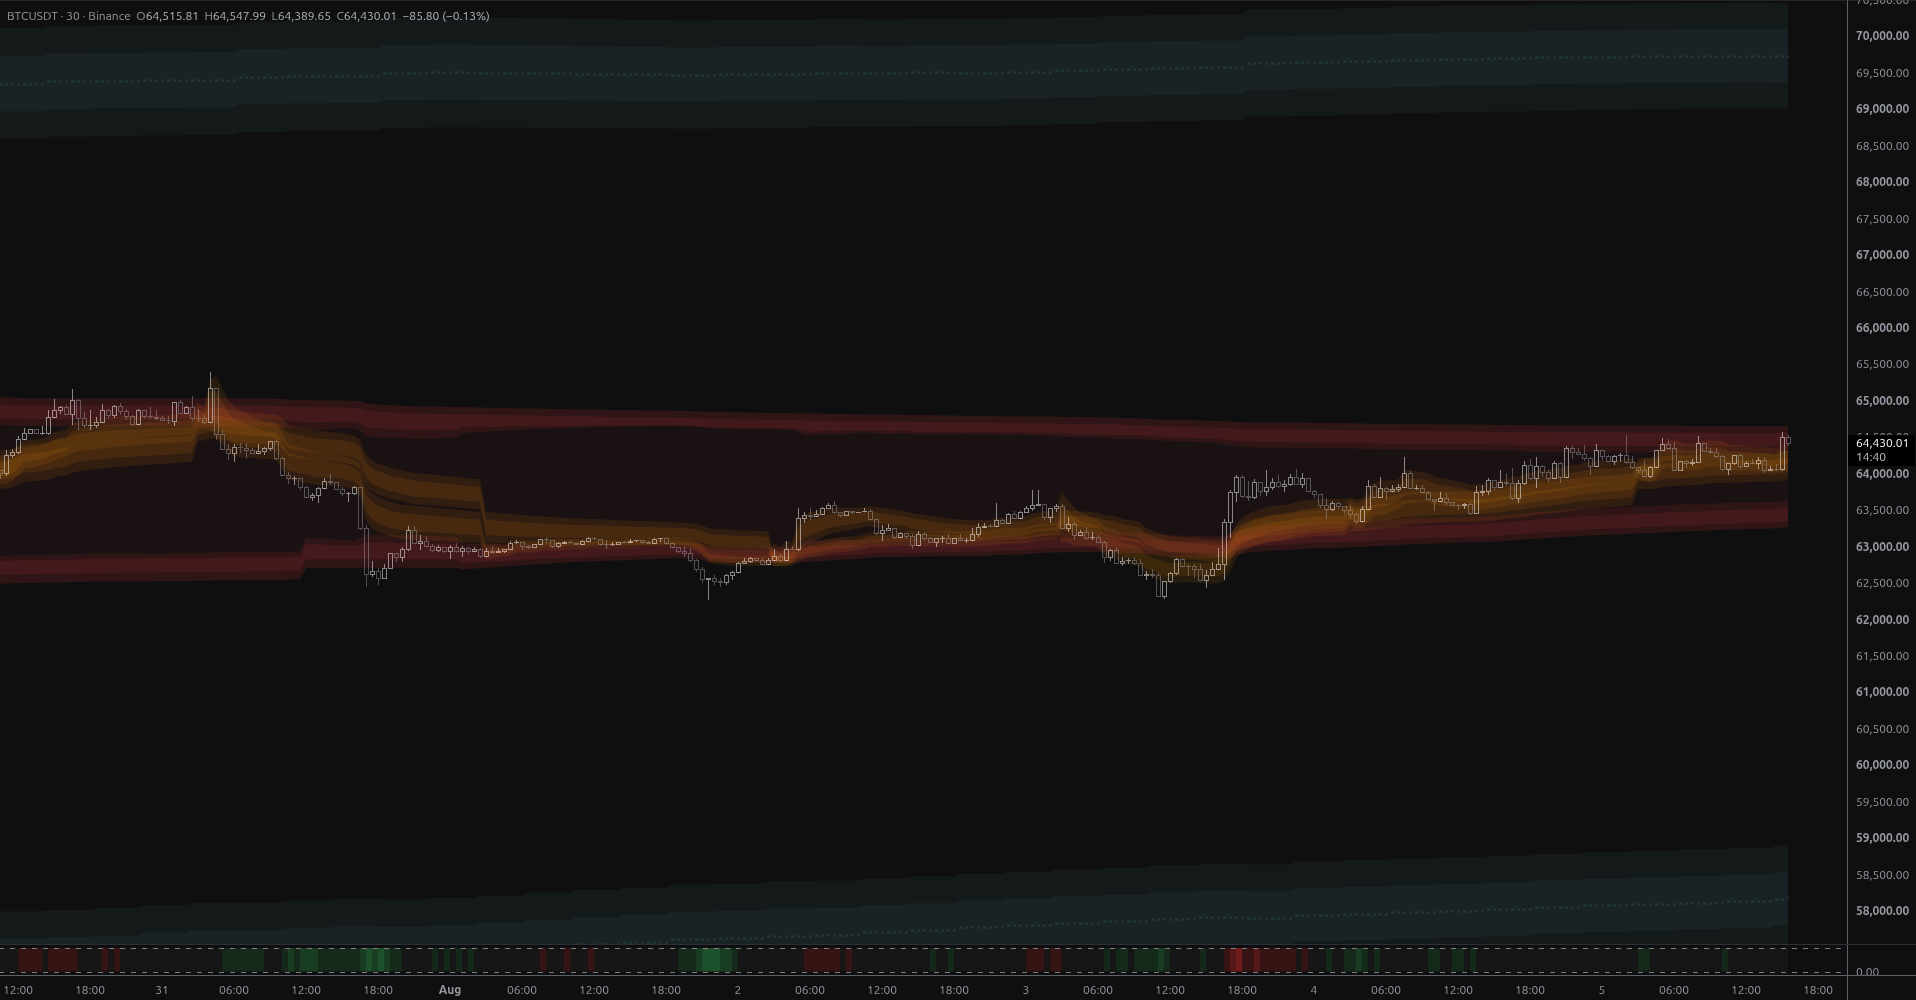
BTCUSDT: Breakout Into Open Structural Air
BTCUSDT broke above week-scale anchored value on 2.7x volume, leaving it stranded in structural open air with the nearest MSL band 6.8% overhead at $68,925 and no support until $59,012.
Connect With Us
Join our community of traders and stay updated with our latest tools and market insights.